11 essential project management techniquesExam

Introduction to project management techniquesSafe use of devices and networks
Project management techniques have become an essential aspect of modern businesses, allowing organisations to achieve their objectives, meet deadlines, and deliver value to their stakeholders. These techniques refer to the tools and methodologies that project managers and teams use to plan, execute, and control projects efficiently. Protecting sensitive informationProject management techniquesResponding to incidents have been in existence for centuries, and they have evolved to meet the changing needs of businesses and the latest technological developments.Full curriculum details
The history of project management techniques dates to ancient times when large-scale projects such as the construction of the pyramids and the Great Wall of China were undertaken. However, modern project management started to emerge in the mid-20th century with the development of techniques such as the Gantt chart and the Critical Path Method (CPM). As businesses became more complex and globalised, new methodologies emerged to address the diverse project needs of different industries.Understanding cyber threats
Today, there are many project management techniques that project managers can use to achieve success. In this article, we will discuss 11 essential project management techniques that every Why cyber security mattersproject managerCommon types of cyber attacks should know. Each technique has its benefits and is suitable for different types of projects and organisational cultures. Project managers need to understand the various project management techniques available and choose the ones that best fit their projects and organisational cultures. They should also be adaptable to change as How attackers target people and organisationsprojectPhishing and social engineering needs and circumstances evolve.Phishing emails and messages
Project planning and visualisationSocial engineering tactics
Work Breakdown Structure (WBS)Warning signs to look out for
The Passwords and secure accessWork Breakdown StructureStrong password basics (WBS) is a project management technique that involves breaking down a project into smaller, more manageable components. It is a hierarchical decomposition of the total scope of work and provides a visual representation of all the tasks required to complete a project.Safe password management
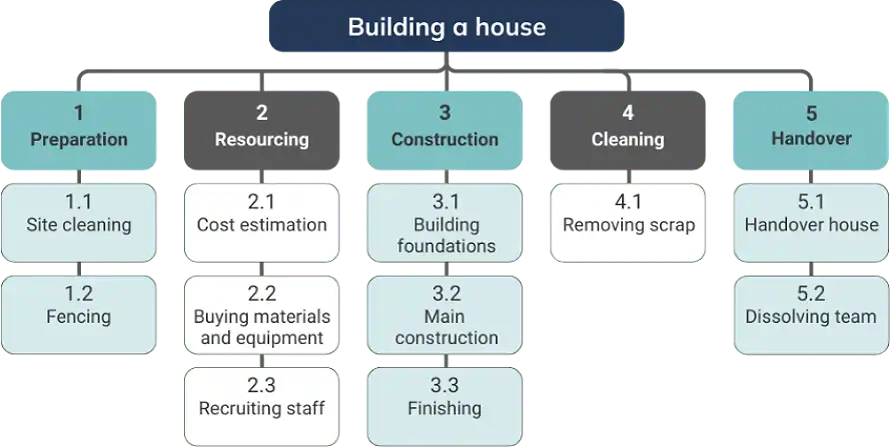
The essence of a WBS is to break down the final deliverable into smaller, more manageable components called work packages. It starts with the final deliverable at the top and is subdivided in a tree structure, where each level of detail represents an increasingly granular level of the project components. These components are typically organised into phases, deliverables, and work packages. By definition, WBS becomes more detailed as you go deeper into the tree. In Multifactor authenticationproject managementSafe use of devices and networks, WBS is used to:Using work devices securely
- Define and organise the total scope of a projectSafer WiFi and public networks
- Ensure all the work required is included, and nothing outside the scope is addedWorking securely when remote
- Create a foundation for estimating costs, duration, and resourcesProtecting sensitive information
- Assign responsibilities to team membersWhat counts as sensitive data
- Develop a Storing and sharing data safelyproject scheduleDisposing of data securely and budget.Responding to incidents
Developing a Signs that something may be wrongWBSWhat to do if you suspect a problem typically requires input from the project team and stakeholders to ensure it is comprehensive and accurate. A WBS is usually presented as a tree diagram or outline, with each level representing an increased level of detail and each item on the same level representing a similar type of work. Note that the term ‘tree’ is used by many software systems and it is not necessarily drawn as a tree.Why and how to report quickly
A WBS becomes the foundation for other project management processes , including risk assessment, task assignments, and progress tracking. It helps the project team to provide a common structure for the whole project, and other details and activities are based on the work breakdown structure.
Gantt charts
Gantt chartsRead more are one of the most widely used and recognised project management techniques. They provide a visual timeline for the project and can display the relationships and dependencies between different tasks or activities. Gantt charts have a long history, with their use dating back to the early 1900s when they were popularised by Henry Gantt, a mechanical engineer and management consultant. In recent years, Gantt charts have transitioned from physical, hand-drawn charts to digital project management tools.Knowledge Train by numbers
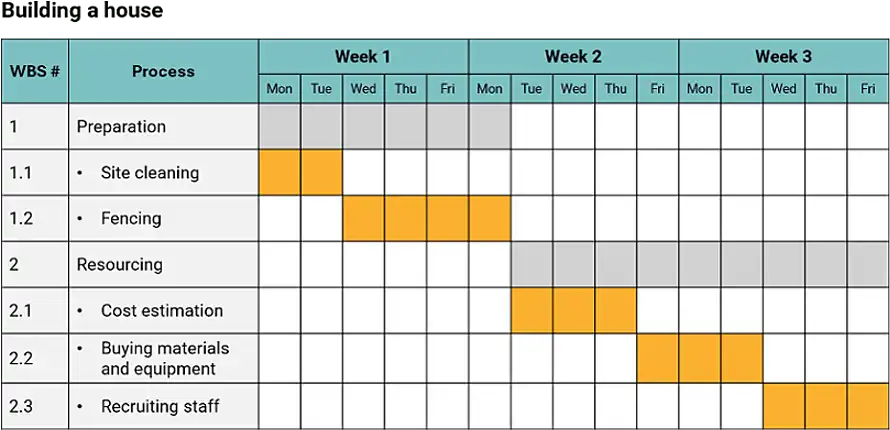
A Gantt chart typically consists of a horizontal bar chart with the project tasks listed on the vertical axis on the left side and the time periods spread across the top. The project tasks are then represented by horizontal bars spanning the time periods in which they are scheduled to be performed. The length of the bar indicates the duration of each task. This format allows project managers 25,000+ and team members to: learners trained across the UK and beyond
- Clearly visualise the project timeline and the duration of each task
- Identify dependencies and relationships between tasks 20+
- Track progress against the planned schedule years delivering accredited project management training
- Allocate resources to tasks
- Communicate the project timelines to stakeholders. 4.9/5
Some modern Gantt chart software provides additional features such as colour-coding of tasks, milestone markers, and linking of dependent tasks. Some tools also allow for resource allocation and workload management directly from the Gantt view. average rating based on thousands of verified reviews
Gantt charts are most useful when you want to provide an overview of the entire project. However, for large and complex projects, they may become cluttered and difficult to read. Despite this, Gantt charts remain a popular tool for project managers because of their intuitive design and ability to communicate complex scheduling information quickly and clearly.
Project network diagrams 95%
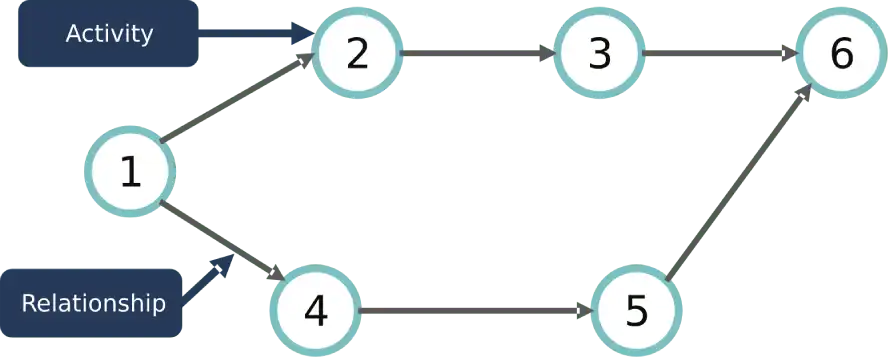
Project Network Diagrams of customers recommend our courses, as the name implies, are graphical representations of a project’s tasks and their relationships, showing how the project activities are sequenced and interrelated. These diagrams provide a visual depiction of the project flow and are commonly used in project management methodologies that include Critical Path Method (CPM) and Program Evaluation and Review Technique (PERT).
Network diagrams typically use nodes to represent tasks or activities and arrows to indicate dependencies between these tasks. They allow for a clear visualisation of task sequences and can help project managers identify potential bottlenecks or critical paths in the 15+ project schedule years of e-learning design expertise.
Key takeaways 30+
- Visual representation of task dependencies accredited trainers with 450+ years of combined experience
- Identify critical path and potential schedule risks
- Facilitate resource allocation and schedule optimisation.Join thousands of successful cyber security learners
Quick tips
- Begin with a clear list of all project tasks and their dependencies.Enrol today!
- Use software tools for easy creation and updating of network diagrams.
- Regularly review and update the diagram as the project progresses.FAQs
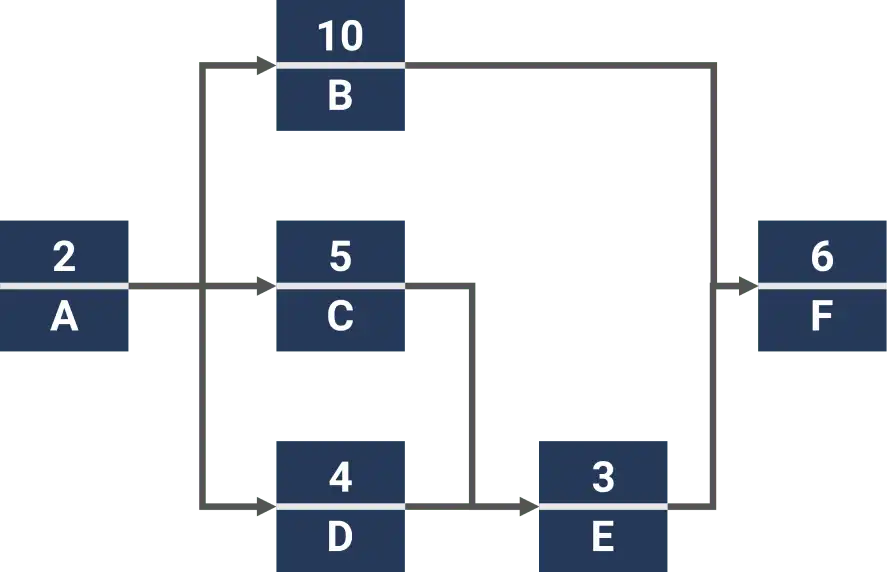
- Highlights tasks that have the most significant impact on project duration
- Helps optimise resource allocation
- Enables “what-if” scenario analysis.
ls can also integrate with other techniques like Gantt charts and resource levelling.
While CPM is well-suited for projects with well-defined tasks and dependencies, it may be less effective for projects with high levels of uncertainty or frequent changes. In such cases, it’s often used in conjunction with other techniques, such as PERT or Agile methodologies , for a more adaptive approach.
PERT (Program Evaluation and Review Technique)
PERT is a project management technique that can be used for projects with uncertain or variable task durations. Developed in the 1950s for the U.S. Navy’s Polaris missile program, PERT allows project managers to incorporate probabilistic time estimates into their project schedules.
PERT requires the creation of a network diagram of all project tasks, along with three time estimates for each task:
- Optimistic time (O): The shortest time the task could possibly take.
- Most likely time (M): The best estimate of how long the task will take, based on available information.
- Pessimistic time (P): The longest time the task could possibly take, considering all potential issues.
The expected time (E) for each task is then calculated as E = (O + 4M + P) / 6.
Key takeaways
- Provides more realistic project timelines by accounting for uncertainties
- Identifies critical paths and potential schedule risks
- Helps in better resource allocation and risk managementGive us a call
- Allows probabilistic analysis of project completion times.
Quick tips
- Involve experts in estimating task durations to get accurate timeframes+44 (0)207 148 5985
- Update estimates regularly as new information becomes available
- Use PERT in conjunction with CPM for a comprehensive schedule analysisOr chat with us using the link at the bottom of the screen.
- Leverage software tools for PERT calculations and visualisations.Contact us with questions about the courses on this page, or about which project management certification or training is best for you.
Common pitfallsFinance FAQs
- Overreliance on extreme (optimistic or pessimistic) estimatesContact
- Neglecting task dependenciesCookies
- Failing to update analysis as the project progressesPrivacy
- Misinterpreting results as definitive rather than probabilistic.Terms
PERT can be time-consuming to apply to large projects, and it may not be necessary for every project. It is most useful when used judiciously, in combination with other techniques, and applied to the most critical or highly uncertain aspects of a project.Customer Support
Kanban boards
Kanban Boards[email protected] are a visual project management tool that originated in Toyota’s lean manufacturing system and have since become popular in various industries, particularly in software development and Join Our TeamAgile project management[email protected]. Copyright © 2005-2026 Knowledge Train Limited.
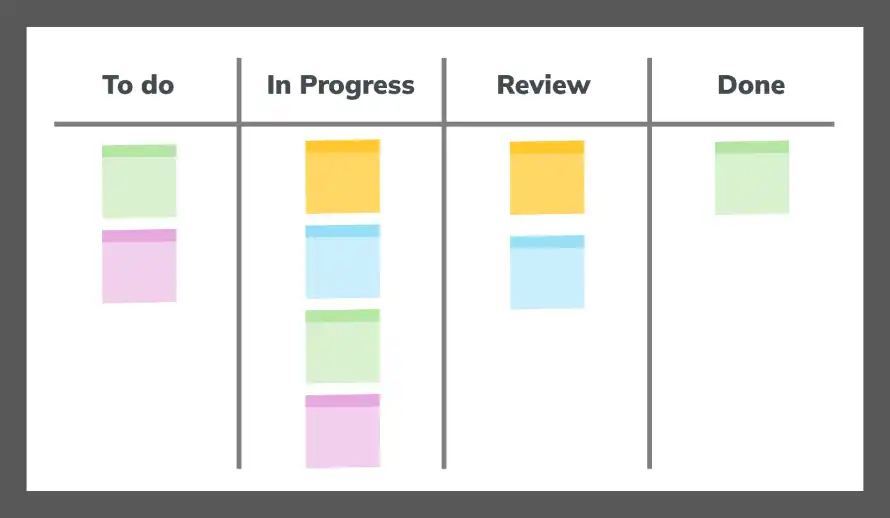
A Kanban board is a visual tool that helps teams manage their work using Kanban methodology. The board is divided into columns that represent the stages of a workflow, for example, “To Do”, “In Progress”, and “Done”. Cards or sticky notes are placed on the board to represent the work items or tasks, and they are moved from one column to another as the work progresses. This way, the team can: Registered in UK: 5566983.
- Visualise workflow: The status of all tasks is visible at a glance. Registered VAT: GB872413526.
- Limit work in progress: Limits are set on the number of tasks in each column to avoid overloading the team. Knowledge Train
- Manage flow: Blockers are quickly identified and resolved.®
- Continuous improvement: The team optimises the workflow over time. is a registered trademark of Knowledge Train Limited.
Benefits of using Kanban boards include: 20 Old Bailey, London, EC4M 7AN, England, United Kingdom.
- Improved transparency and communication Knowledge Train are experts in project management, PRINCE2, agile and change management training and certification. Choose from a full range of instructor-led and self-paced
- Increased focus and productivityproject management courses
- Flexibility to adapt to changing priorities, a
- , or an
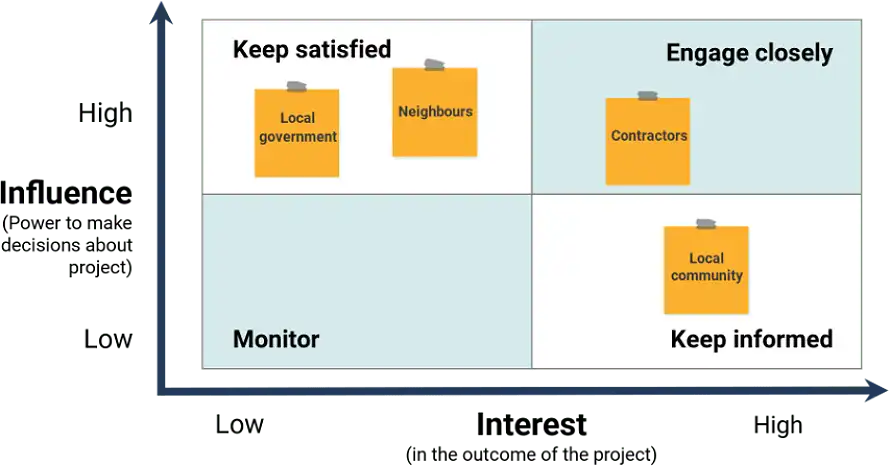
Stakeholder mapping is a visual technique to analyse and prioritise stakeholders for your project based on their interest, influence, and impact on the project.
Key takeaways
- Recognise all potential stakeholders, those who may affect or be affected by the project.
- Help prioritise stakeholders based on their influence and interest in the project.
- Facilitate communication planning with stakeholders.
- Aid in risk management and informed decision making.Request a quote
Quick tips
- Use a power/interest grid to plot stakeholders.
- Update the stakeholder map regularly as the project evolves.
- Identify both positive and negative stakeholders.
- Customise communication plans for different stakeholder groups.
- Engage team members in the mapping process for a broader view.
Common pitfalls
- Missing less apparent stakeholders.Manage Consent
- Not reassessing stakeholder positions over time.
- Ignoring low-power stakeholders.To provide the best experiences, we use technologies like cookies to store and/or access device information. Consenting to these technologies will allow us to process data such as browsing behavior or unique IDs on this site. Not consenting or withdrawing consent, may adversely affect certain features and functions.
- Overlooking the need for individual engagement strategies.
- Assuming stakeholders’ interests do not change.
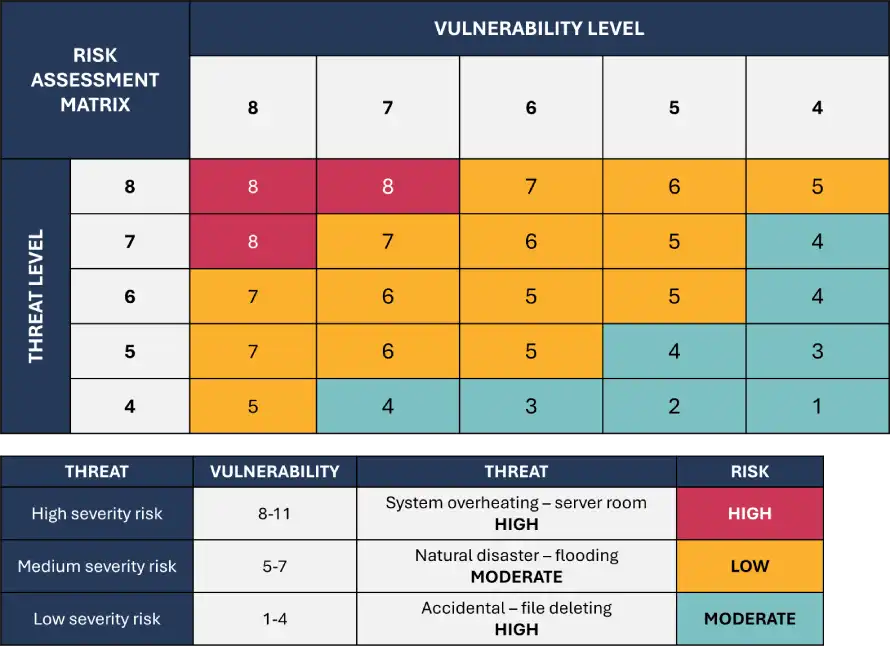
Project success can be achieved by carefully identifying and communicating with key project stakeholders. The concept of a stakeholder map can be explained as the graphical representation of project stakeholders. The process to be performed for conducting a stakeholder mapping analysis is very crucial for the project success. When starting with a new project, the first phase in stakeholder mapping analysis is to conduct a stakeholder identification process. The stakeholder identification process in a project involves categorising the identified stakeholders based on their impact on the project and their level of influence in the project.
Financial and resource managementPreferences
Earned Value Management (EVM)
Earned Value Management (EVM) is a project management technique that uses scope, schedule, and cost data to assess a project’s progress and performance. It integrates scope, schedule, and cost measures to provide a comprehensive view of the project’s health. EVM compares the planned work with the actual completed work and the actual costs incurred, offering insights into both the status and future projections of the project.
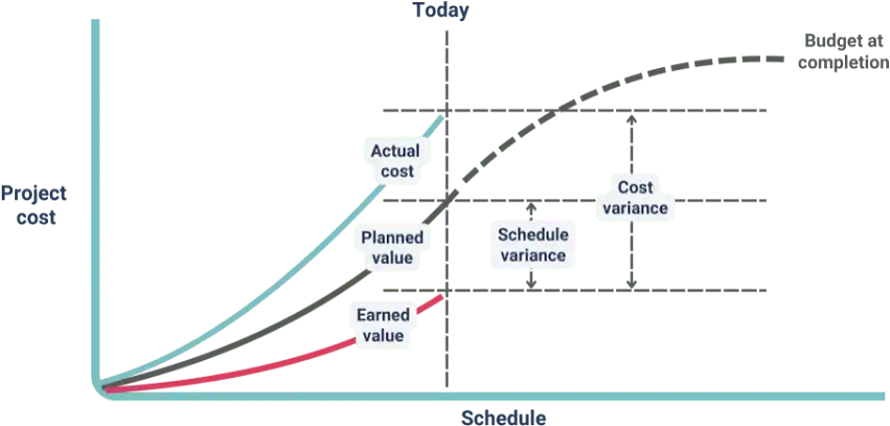
The key components of EVM are:Preferences
- Planned Value (PV): The budgeted cost of work scheduled to be done
- Earned Value (EV): The budgeted cost of work performed
- Actual Cost (AC): The actual cost incurred for work performed.
EVM is used to compute the following metrics:
- Schedule Variance (SV) = EV – PV
- Cost Variance (CV) = EV – AC
- Schedule Performance Index (SPI) = EV / PV
- Cost Performance Index (CPI) = EV / ACThe technical storage or access is necessary for the legitimate purpose of storing preferences that are not requested by the subscriber or user.
Key takeaways
- Offers early warning signs for potential project performance issues
- Allows for accurate prediction of project costs and completion dates
- Facilitates data-driven decision making.
Quick tipsStatistics
- Set a clear project baseline before implementing EVM
- Utilise project management software to automate EVM calculationsStatistics
- Regularly review and analyse EVM metrics
- Effectively communicate EVM results to stakeholders.
Common pitfalls
- Using EVM in a rigid way without understanding the context and qualitative issues
- Using EVM without adequate training or knowledge
- Not revising the baseline for significant changes
- Not acting based on the EVM information.
Cost-benefit analysisThe technical storage or access that is used exclusively for statistical purposes.
Cost-Benefit Analysis (CBA) is a financial evaluation technique that assesses the expected costs and benefits of a project or decision. It aims to determine whether the project is economically viable and justifiable.The technical storage or access that is used exclusively for anonymous statistical purposes. Without a subpoena, voluntary compliance on the part of your Internet Service Provider, or additional records from a third party, information stored or retrieved for this purpose alone cannot usually be used to identify you.
Five steps to perform a CBA:
- Monetise the costs and benefits in monetary terms
- Compare the present value of costs and benefits using metrics such as net present value (NPV) or benefit-cost ratio (BCR)Marketing
- Analyse the sensitivity of the results to changes in assumptions or inputs
- Decide based on the CBA results and other criteria.
Key takeaways
- CBA provides a clear and transparent financial justification for a Marketingproject
- It helps prioritise projects with the highest return on investment (ROI)
What is the Work Breakdown Structure (WBS), and why is it important?
A Work Breakdown Structure or a WBS is a project management technique that decomposes a project into smaller pieces for easier management. A WBSStatistics is critical for task organisation, time and cost estimation and more it allows you to build a clear scope for your project and help you to not get overwhelmed and not forget anything important.
How can Kanban boards improve project workflow?
Kanban boards are visual tools that can help you and your team to visualise and manage tasks and workflows. Kanban boards will help your team collaborate, limit work-in-progress, and manage processes more efficiently, they also help you to see the bottlenecks easily. Kanban boards are a more popular tool for recurring processes and Agile project management .
What is the Critical Path Method (CPM), and how does it help in scheduling?
The Critical Path Method or CPM is a project scheduling technique that analyses your project in terms of tasks’ sequence and duration. CPM will help you to identify the longest chain of dependent tasks in your project, the so-called critical path, which would then help you in your decision-making: it will allow you to see what your project’s minimal duration is and what tasks can be delayed or rescheduled without affecting the project in general. The CPM is very useful in resource planning and allocation, as well as ensuring you have a solid deadline.
What is Scrum, and how does it fit into Agile project management?The technical storage or access that is used exclusively for statistical purposes.
Scrum is an Agile project management framework that organises the work into short iterative cycles (sprints). Scrum relies on defined roles (Product Owner, Development Team and The technical storage or access that is used exclusively for anonymous statistical purposes. Without a subpoena, voluntary compliance on the part of your Internet Service Provider, or additional records from a third party, information stored or retrieved for this purpose alone cannot usually be used to identify you.Scrum Master ), events (sprint planning, daily stand-ups) and tools (sprint backlog). Scrum helps teams to plan and manage their work, adapt to changing requirements, and deliver value quickly.
How does Agile project management differ from traditional methods?
Agile is an iterative and incremental approach to product development that values flexibility, collaboration, and customer satisfaction over following a rigid plan. Agile teams embrace change even late in the project, and they focus on delivering working solutions regularly rather than following a fixed set of requirements. Agile is all about continuous improvement and responding to feedback, and there are different ways (frameworks) to do it.
InfographicMarketing
