

Key takeawaysSelect your preferred training course below:
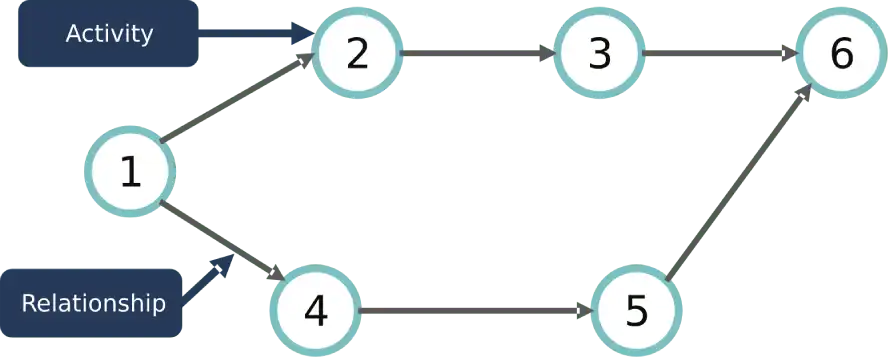
- Visual representation of task dependencies
- Identify critical path and potential schedule risksAIPGF COURSES
- Facilitate resource allocation and schedule optimisation.Select your preferred training course below:
Quick tips
- Begin with a clear list of all project tasks and their dependencies.AI WORKSHOPS
- Use software tools for easy creation and updating of network diagrams.Select your preferred workshop below:
- Regularly review and update the diagram as the project progresses.
- Utilise color-coding to highlight critical paths or high-risk activities.Knowledge Train is a PRINCE2 Accredited Training Organization.
Common pitfalls
- Overlooking important task dependencies.Knowledge Train is an AgilePM Accredited Training Organization.
- Creating overly complex diagrams that are difficult to understand.
- Failing to update the diagram as project scope or timelines change.Knowledge Train is a PRINCE2 Agile Accredited Training Organization.
- Neglecting to consider resource constraints when analysing the network.
- Identifying all project tasks
- Determining task dependencies
- Estimating task durationsBCS accredited training partner for Business Analysis.
- Calculating the earliest and latest start and finish times for each task
- Identifying the critical path and the float time for non-critical tasks.Knowledge Train is a Change Management Accredited Training Organization.
The critical path represents the sequence of tasks that directly affects the project’s overall duration. Any delay in a critical path task will result in a delay in the project completion date, unless the delay is addressed through corrective action.
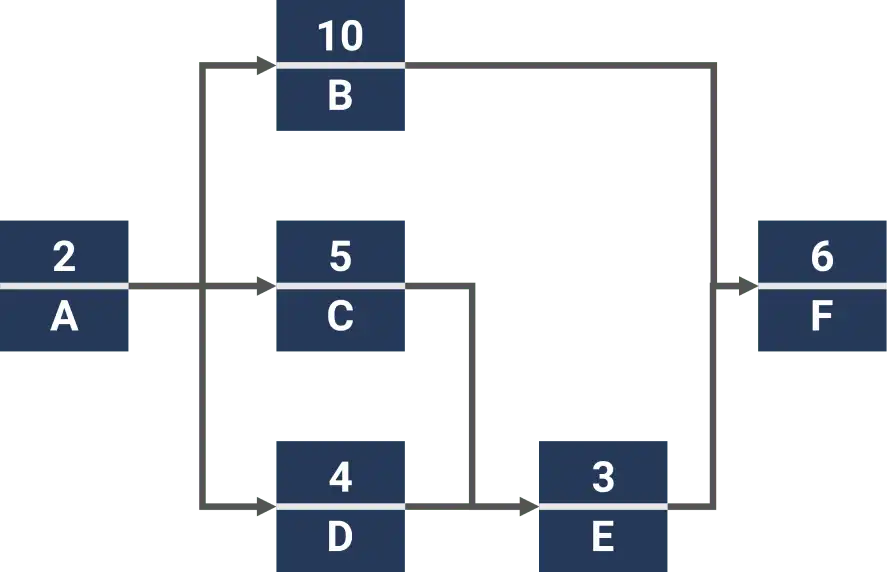
CPM offers several benefits:Knowledge Train is an MSP Accredited Training Organization.
- Provides a visual overview of project schedules
- Highlights tasks that have the most significant impact on project durationAXELOS Peoplecert accredited training organisation for ITIL (IT Infrastructure Library).
- Helps optimise resource allocation
- Enables “what-if” scenario analysis.AXELOS Peoplecert accredited training organisation for ITIL (IT Infrastructure Library).
- Certification exam(s) where applicable
- Pessimistic time (P): The longest time the task could possibly take, considering all potential issues.Accredited training course materials
The expected time (E) for each task is then calculated as E = (O + 4M + P) / 6.Support from expert, experienced trainers
Key takeawaysLatest educational technology.
- Provides more realistic project timelines by accounting for uncertainties
- Identifies critical paths and potential schedule risksBUSINESS SOLUTIONS
- Helps in better resource allocation and
Custom e-Learning developmentCommon pitfalls
- Overreliance on extreme (optimistic or pessimistic) estimates
- Neglecting task dependencies
- Failing to update analysis as the project progressesFind out more
- Misinterpreting results as definitive rather than probabilistic.
PERT can be time-consuming to apply to large projects, and it may not be necessary for every project. It is most useful when used judiciously, in combination with other techniques, and applied to the most critical or highly uncertain aspects of a project.
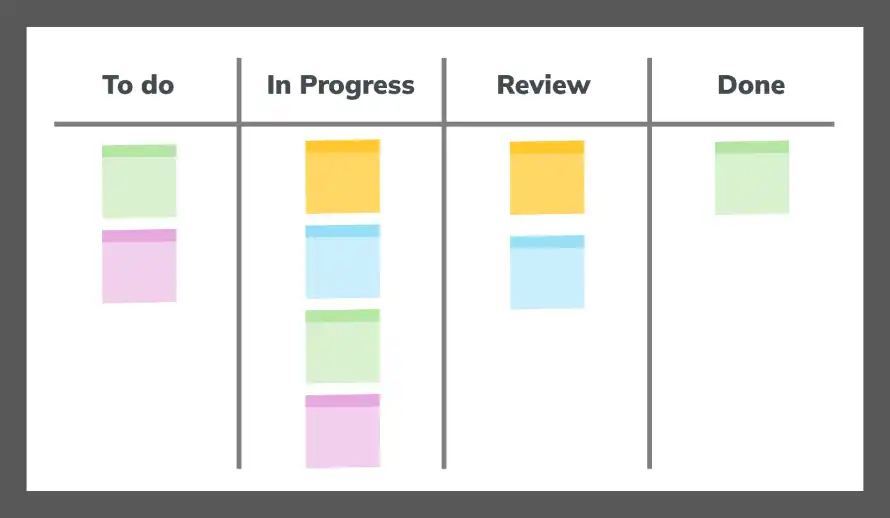
Kanban boards
Kanban Boards are a visual project management tool that originated in Toyota’s lean manufacturing system and have since become popular in various industries, particularly in software development and Agile project CONTACT USmanagement .
Request a quote
Key takeaways
- Recognise all potential stakeholders, those who may affect or be affected by the project.
- Help prioritise stakeholders based on their influence and interest in the project.
- Facilitate communication planning with stakeholders.
- Aid in +44 (0)207 148 5985risk management and informed decision making.[email protected]
Quick tips
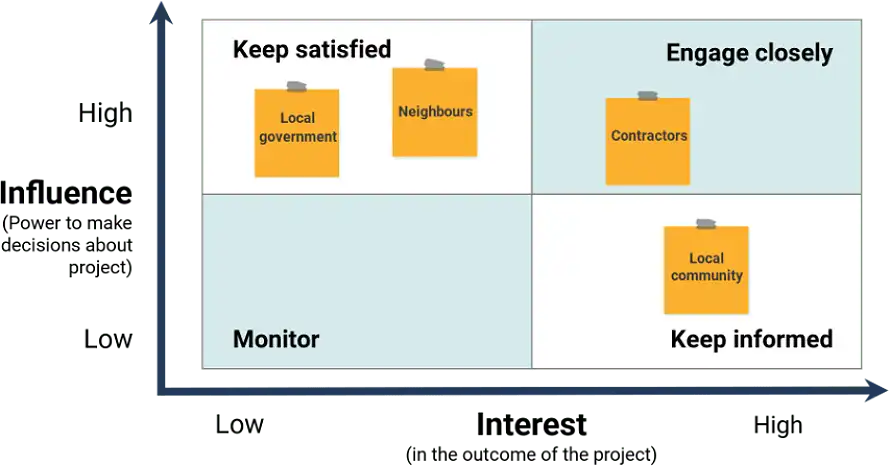
- Use a power/interest grid to plot stakeholders.
- Update the stakeholder map regularly as the project evolves.
- Identify both positive and negative stakeholders.
- Customise communication plans for different stakeholder groups.
- Engage team members in the mapping process for a broader view.
Common pitfalls
- Missing less apparent stakeholders.United Kingdom
- Not reassessing stakeholder positions over time.
- Ignoring low-power stakeholders.
- Overlooking the need for individual engagement strategies.
- Assuming stakeholders’ interests do not change.
Project success can be achieved by carefully identifying and communicating with key project stakeholders. The concept of a stakeholder map can be explained as the graphical representation of project stakeholders. The process to be performed for conducting a stakeholder mapping analysis is very crucial for the project success. When starting with a new project, the first phase in stakeholder mapping analysis is to conduct a stakeholder identification process. The stakeholder identification process in a project involves categorising the identified stakeholders based on their impact on the project and their level of influence in the project.
Financial and resource managementLithuania
Earned Value Management (EVM)Luxemburg
Earned Value ManagementMalta (EVM) is a project management technique that uses scope, schedule, and cost data to assess a project’s progress and performance. It integrates scope, schedule, and cost measures to provide a comprehensive view of the project’s health. EVM compares the planned work with the actual completed work and the actual costs incurred, offering insights into both the status and future projections of the project.Netherlands
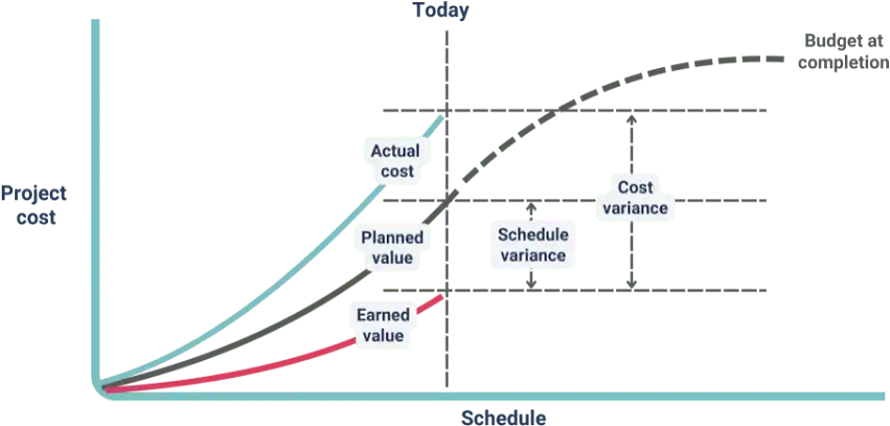
The key components of EVM are:Poland
- Planned Value (PV): The budgeted cost of work scheduled to be donePortugal
- Earned Value (EV): The budgeted cost of work performedRomania
- Actual Cost (AC): The actual cost incurred for work performed.Slovakia
EVM is used to compute the following metrics:Slovenia
- Schedule Variance (SV) = EV – PVSpain
- Cost Variance (CV) = EV – ACSweden
- Schedule Performance Index (SPI) = EV / PVOther countries
- Cost Performance Index (CPI) = EV / ACHome
Key takeawaysAgile
- Offers early warning signs for potential project performance issuesAgile Project Management
- Allows for accurate prediction of project costs and completion datesAgile Project Management Course
- Facilitates data-driven decision making.Kanban principles
Quick tips
- Set a clear project baseline before implementing EVM{"@context":"http://schema.org","@type":"BreadcrumbList","itemListElement":[{"@type":"ListItem","position":1,"name":"Home","item":"https://www.knowledgetrain.co.uk/"},{"@type":"ListItem","position":2,"name":"Agile","item":"https://www.knowledgetrain.co.uk/agile"},{"@type":"ListItem","position":3,"name":"Agile Project Management","item":"https://www.knowledgetrain.co.uk/agile/agile-project-management"},{"@type":"ListItem","position":4,"name":"Agile Project Management Course","item":"https://www.knowledgetrain.co.uk/agile/agile-project-management/agile-project-management-course"},{"@type":"ListItem","position":5,"name":"Kanban principles","item":"https://www.knowledgetrain.co.uk/agile/agile-project-management/agile-project-management-course/kanban-principles"}]}
- Utilise project management software to automate EVM calculations
- Regularly review and analyse EVM metricsThe 4 Kanban principles: A visual guide
- Effectively communicate EVM results to stakeholders.
Common pitfallsSimon Buehring
- Using EVM in a rigid way without understanding the context and qualitative issues19 Feb 2026
- Using EVM without adequate training or knowledge
- Not revising the baseline for significant changes
- Not acting based on the EVM information.
Cost-benefit analysis
Cost-Benefit Analysis (CBA) is a financial evaluation technique that assesses the expected costs and benefits of a project or decision. It aims to determine whether the project is economically viable and justifiable.
Five steps to perform a CBA:
- Identify all the costs and benefits associated with the project
- Monetise the costs and benefits in monetary terms
- Compare the present value of costs and benefits using metrics such as net present value (NPV) or benefit-cost ratio (BCR)
- Analyse the sensitivity of the results to changes in assumptions or inputs
- Decide based on the CBA results and other criteria.
Key takeaways
- CBA provides a clear and transparent financial justification for a project
- It helps prioritise projects with the highest return on investment (ROI)
- It supports objective and rational decision-making.
Quick tips
- Identify and include all relevant costs and benefits, both tangible and intangible
- Use realistic and consistent assumptions and data sources
- Involve subject matter experts in the analysis process
- Review and update the CBA regularly to reflect changes in the project or environment.Copied!
Common pitfallsKey takeaways
- Overlooking or underestimating hidden or long-term costs or benefitsKanban helps teams manage work visually, reduce waste, and improve delivery through steady flow.
- Overestimating the benefits or underestimating the costsMake work visible on a board so every character can spot progress, priorities, and problems quickly.
- Not considering alternative options or the status quoUse a pull system so new work starts only when there is capacity, preventing queues and overload.
- Not accounting for risks and uncertainties.Set WIP limits per column to reduce multitasking and expose bottlenecks early.
Resource levellingFocus on flow by watching for stoppages and tracking simple measures like lead time and cycle time.
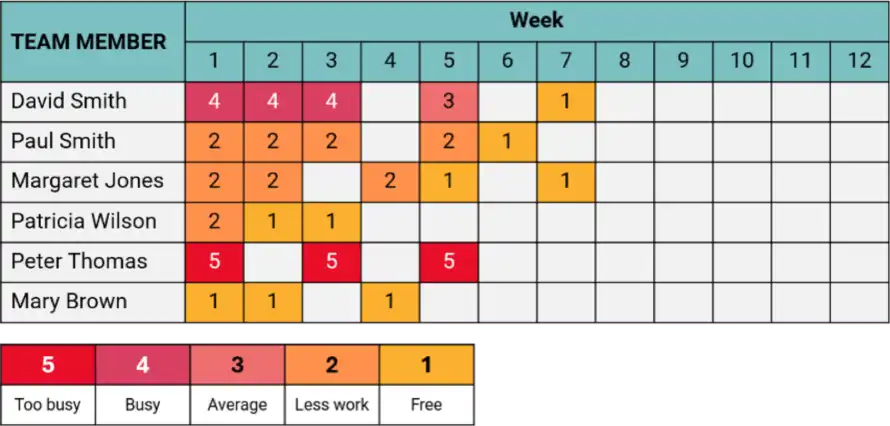
Resource levelling is a technique for managing project resources to achieve optimal resource utilisation. It involves adjusting the allocation of resources to tasks so that resource demand does not exceed the available supply. By smoothing out the use of resources, resource levelling can reduce overallocation and idle time.Continuously review the board and adjust the process so improvements become routine, not occasional.
Key takeaways
- Resource levelling can lead to better resource utilisation and increased productivity.
- It can help avoid burnout and reduce project risks.
- It can help project managers create more realistic Contentsschedules .
Quick tipsContents
- Identify resource constraints early in the project planning process.
- Use Introductionproject management software
