11 essential project management techniquesDenmark

Introduction to project management techniquesKey takeaways
Project management techniques have become an essential aspect of modern businesses, allowing organisations to achieve their objectives, meet deadlines, and deliver value to their stakeholders. These techniques refer to the tools and methodologies that project managers and teams use to plan, execute, and control projects efficiently. Fishbone diagrams help teams move from symptoms to root causes with a clear, shared view of the problem.Project management techniquesDefine a precise problem statement first, as it determines the focus and usefulness of the analysis. have been in existence for centuries, and they have evolved to meet the changing needs of businesses and the latest technological developments.Brainstorm widely with cross-functional characters to reduce blind spots and incomplete cause lists.
The history of project management techniques dates to ancient times when large-scale projects such as the construction of the pyramids and the Great Wall of China were undertaken. However, modern project management started to emerge in the mid-20th century with the development of techniques such as the Gantt chart and the Critical Path Method (CPM). As businesses became more complex and globalised, new methodologies emerged to address the diverse project needs of different industries.Group causes into clear categories, using standard headings or custom ones that fit your context.
Today, there are many project management techniques that project managers can use to achieve success. In this article, we will discuss 11 essential project management techniques that every Review the diagram during the session to catch overlaps, duplicates, and missing factors early.project managerPrioritise likely high-impact causes using simple ranking or voting before investigating solutions. should know. Each technique has its benefits and is suitable for different types of projects and organisational cultures. Project managers need to understand the various project management techniques available and choose the ones that best fit their projects and organisational cultures. They should also be adaptable to change as project needs and circumstances evolve.
Project planning and visualisationContents
Work Breakdown Structure (WBS)
The Work Breakdown StructureContents (WBS) is a project management technique that involves breaking down a project into smaller, more manageable components. It is a hierarchical decomposition of the total scope of work and provides a visual representation of all the tasks required to complete a project.
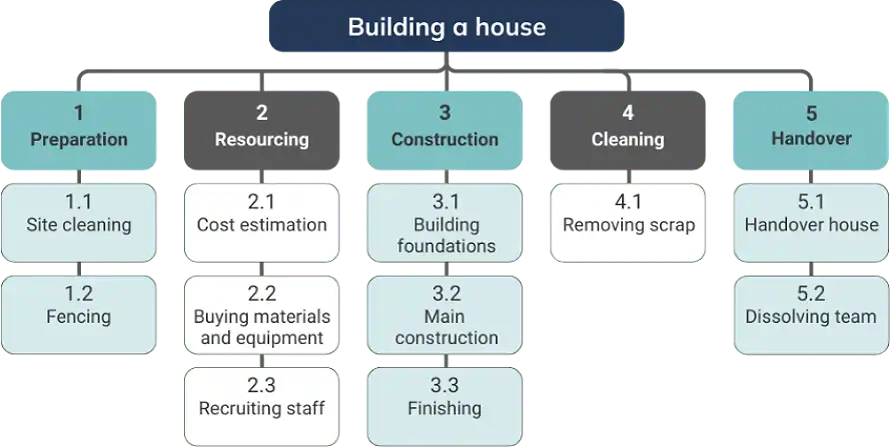
The essence of a WBS is to break down the final deliverable into smaller, more manageable components called work packages. It starts with the final deliverable at the top and is subdivided in a tree structure, where each level of detail represents an increasingly granular level of the project components. These components are typically organised into phases, deliverables, and work packages. By definition, WBS becomes more detailed as you go deeper into the tree. In Introduction to fishbone diagramsproject management , WBS is used to:Understanding fishbone diagram
- Define and organise the total scope of a project
- Ensure all the work required is included, and nothing outside the scope is addedVariations and procedures
- Create a foundation for estimating costs, duration, and resources
- Assign responsibilities to team membersApplications and case studies
- Develop a project scheduleChallenges and solutions and budget.
Developing a FAQsWBS typically requires input from the project team and stakeholders to ensure it is comprehensive and accurate. A WBS is usually presented as a tree diagram or outline, with each level representing an increased level of detail and each item on the same level representing a similar type of work. Note that the term ‘tree’ is used by many software systems and it is not necessarily drawn as a tree.Infographic
A WBS becomes the foundation for other Introduction to fishbone diagramsproject management processesWhat is a fishbone diagram?, including risk assessment, task assignments, and progress tracking. It helps the project team to provide a common structure for the whole project, and other details and activities are based on the work breakdown structure.A
Gantt chartsfishbone diagram
Gantt charts, also known as an are one of the most widely used and recognised project management techniques. They provide a visual timeline for the project and can display the relationships and dependencies between different tasks or activities. Gantt charts have a long history, with their use dating back to the early 1900s when they were popularised by Henry Gantt, a mechanical engineer and management consultant. In recent years, Gantt charts have transitioned from physical, hand-drawn charts to digital project management tools.Ishikawa diagram
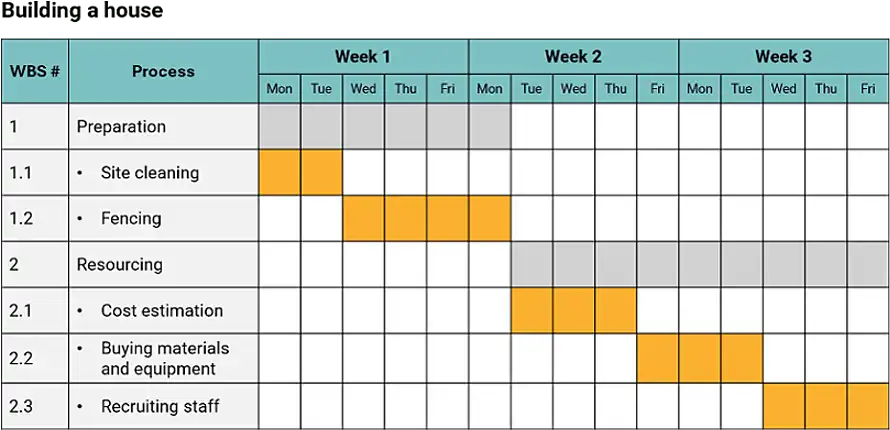
A Gantt chart typically consists of a horizontal bar chart with the project tasks listed on the vertical axis on the left side and the time periods spread across the top. The project tasks are then represented by horizontal bars spanning the time periods in which they are scheduled to be performed. The length of the bar indicates the duration of each task. This format allows or a cause-and-effect diagram, is a fundamental tool in project managersquality management and team members to:. Named after its creator, Kaoru Ishikawa, this diagram helps in identifying root causes of a problem by organising potential causes into useful categories. The visual structure resembles a fish skeleton, with the problem statement at the ‘head’ and contributing factors branching off as ‘bones.’ This structured approach facilitates effective brainstorming sessions, enabling teams to explore a wide range of possible causes systematically.
- Clearly visualise the project timeline and the duration of each taskImportance in problem-solving
- Identify dependencies and relationships between tasksFishbone diagrams are vital in quality management and continuous improvement efforts across numerous industries. They are one of the Seven Basic Quality Tools, essential for identifying and resolving issues efficiently. The diagrams help teams develop specific solutions and are particularly valuable in
- Track progress against the planned scheduleManufacturing sectors
- Allocate resources to tasks use them to identify and address production process inefficiencies
- Communicate the project timelines to stakeholders.Healthcare organisations
Some modern Gantt chart software provides additional features such as colour-coding of tasks, milestone markers, and linking of dependent tasks. Some tools also allow for resource allocation and workload management directly from the Gantt view. use them to improve patient care by analysing procedural issues
Gantt charts are most useful when you want to provide an overview of the entire project. However, for large and complex projects, they may become cluttered and difficult to read. Despite this, Gantt charts remain a popular tool for project managers because of their intuitive design and ability to communicate complex scheduling information quickly and clearly.Service industries
Project network diagrams use them to enhance customer satisfaction by resolving service concerns.
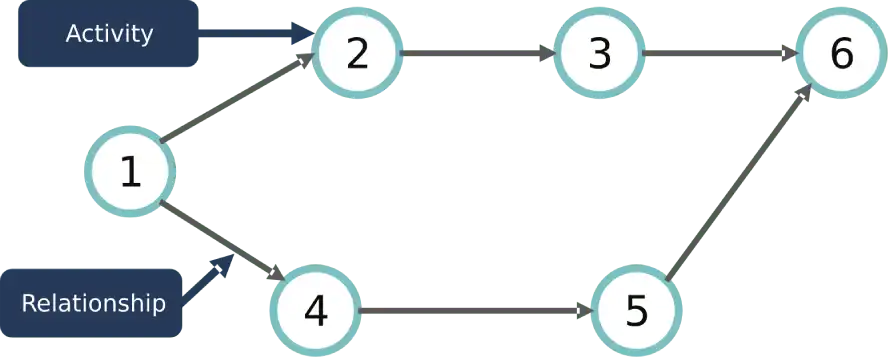
Project Network DiagramsIn essence, fishbone diagrams not only aid in identifying the root causes of problems but also promote a culture of systematic analysis and continuous improvement. By applying this method, organisations can ensure that they address issues comprehensively, leading to more effective and lasting solutions., as the name implies, are graphical representations of a project’s tasks and their relationships, showing how the project activities are sequenced and interrelated. These diagrams provide a visual depiction of the project flow and are commonly used in project management methodologies that include Critical Path Method (CPM) and Program Evaluation and Review Technique (PERT).Understanding fishbone diagram components
Network diagrams typically use nodes to represent tasks or activities and arrows to indicate dependencies between these tasks. They allow for a clear visualisation of task sequences and can help project managers identify potential bottlenecks or critical paths in the Basic structure of a fishbone diagramproject scheduleA .fishbone diagram
Key takeaways is a visual tool that helps teams identify and categorise the root causes of a problem. The diagram resembles the skeleton of a fish, making it intuitive and straightforward to use. At the ‘head’ of the diagram, you place the
- Visual representation of task dependenciesproblem statement
- Identify critical path and potential schedule risks – the issue that needs addressing. This serves as the focal point of the analysis.
- Facilitate resource allocation and schedule optimisation.Branching off from the spine are the ‘bones,’ which represent potential
Quick tipscauses
- Begin with a clear list of all project tasks and their dependencies. of the problem. These are organised into various categories, allowing teams to explore different angles of the issue systematically. Each ‘bone’ signifies a distinct cause or factor, and further branching can detail sub-causes. This structured layout not only clarifies complex problems but also encourages comprehensive brainstorming and analysis.
- Use software tools for easy creation and updating of network diagrams.Categories in fishbone diagrams
- Regularly review and update the diagram as the project progresses.Standard categories
- Utilise color-coding to highlight critical paths or high-risk activities.Fishbone diagrams
Common pitfalls often use standard categories to organise potential causes, especially in
- Overlooking important task dependencies.quality management
- Creating overly complex diagrams that are difficult to understand. and engineering contexts. These categories help ensure a comprehensive analysis by covering different aspects of the problem. Commonly used categories include:
- Failing to update the diagram as project scope or timelines change.Methods
- Neglecting to consider resource constraints when analysing the network.: Processes or procedures that might contribute to the issue
By learning project network diagrams, managers can enhance their ability to plan, schedule, and control complex projects effectively.Materials
Scheduling and time management
Critical Path Method (CPM)
The Critical Path MethodSelf-paced (CPM) is a fundamental project management technique used to determine the longest sequence of dependent tasks that must be completed for a project to be finished on time. This sequence of tasks is known as the critical path. The CPM was first developed in the late 1950s and has since been widely adopted for BCS Foundation Certificate in Business Analysis self-paced onlineproject scheduling and control in various industries.£499 +vat
CPM involves the following key steps:
- Identifying all project tasks
- Determining task dependencies
- Estimating task durationsSelf-paced
- Calculating the earliest and latest start and finish times for each taskBCS International Diploma in Business Analysis self-paced online
- Identifying the critical path and the float time for non-critical tasks.
The critical path represents the sequence of tasks that directly affects the project’s overall duration. Any delay in a critical path task will result in a delay in the project completion date, unless the delay is addressed through corrective action.£2,199 +vat
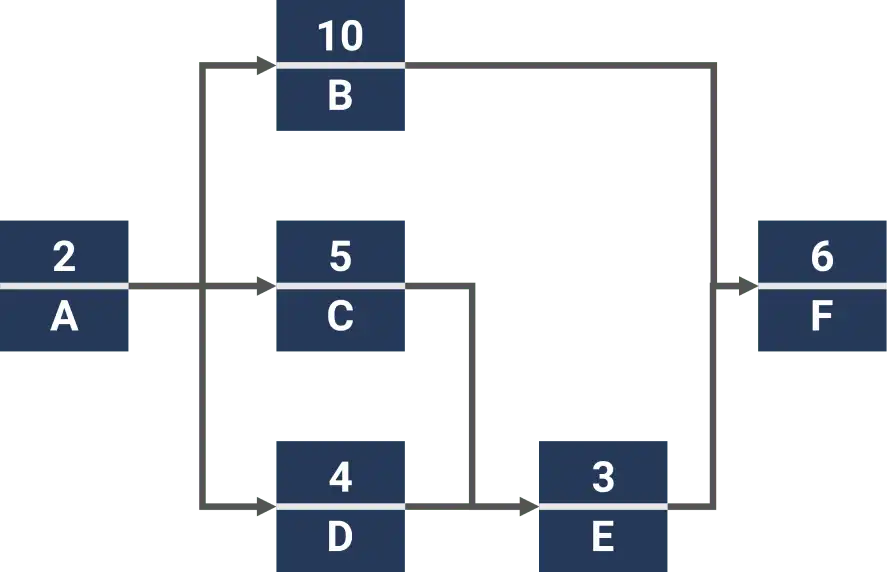
CPM offers several benefits:
- Provides a visual overview of project schedules
- Highlights tasks that have the most significant impact on project duration
- Helps optimise resource allocationSelf-paced
- Enables “what-if” scenario analysis.BCS Business Analysis Practice self-paced online
ls can also integrate with other techniques like Gantt charts and resource levelling.Variations of the fishbone diagram
While CPM is well-suited for projects with well-defined tasks and dependencies, it may be less effective for projects with high levels of uncertainty or frequent changes. In such cases, it’s often used in conjunction with other techniques, such as PERT or Fishbone diagrams come in several variations, each designed to suit specific analytical needs. These nuanced versions adapt the basic structure to address particular types of problems or sectors. For instance, some organisations may opt for a Agile methodologiessimple fishbone diagram, for a more adaptive approach. without predetermined categories. This approach allows teams to define categories that are most relevant to their context, promoting flexibility in analysis.
PERT (Program Evaluation and Review Technique)Other variations may incorporate additional layers of complexity. For example, a
PERTcomplex fishbone diagram is a project management technique that can be used for might include sub-categories or integrate quantitative data to enhance the depth of analysis. These variations are particularly useful in industries that require detailed scrutiny, such as engineering or pharmaceuticals. By tailoring the diagram to specific needs, teams can ensure a more precise and effective root cause analysis.projectsStep-by-step procedure for creating a fishbone diagram with uncertain or variable task durations. Developed in the 1950s for the U.S. Navy’s Polaris missile program, PERT allows project managers to incorporate probabilistic time estimates into their project schedules.Identifying the problem
PERT requires the creation of a network diagram of all project tasks, along with three time estimates for each task:The first step in creating a fishbone diagram is to clearly define the
- Optimistic time (O): The shortest time the task could possibly take.problem statement
- Most likely time (M): The best estimate of how long the task will take, based on available information.. This should be a concise description of the issue you are trying to address. A well-defined problem statement serves as the ‘head’ of the diagram and guides the entire analysis process.
- Pessimistic time (P): The longest time the task could possibly take, considering all potential issues.Brainstorming causes
The expected time (E) for each task is then calculated as E = (O + 4M + P) / 6.Once the problem is defined, the next step is to
Key takeawaysbrainstorm potential causes
- Provides more realistic project timelines by accounting for uncertainties. Encourage team collaboration to gather a wide range of possible factors. Use techniques such as mind mapping or group discussions to ensure all perspectives are considered. This comprehensive list of causes will form the ‘bones’ of your diagram.
- Identifies critical paths and potential schedule risksCategorising causes
- Helps in better resource allocation and After brainstorming, organise the identified causes into risk managementrelevant categories
- Allows probabilistic analysis of project completion times.. These categories can be standard ones like Methods, Materials, and Manpower, or custom ones tailored to your specific context. Proper categorisation helps in visualising the problem from different angles and ensures no potential cause is overlooked.
Quick tipsAnalysing and prioritising causes
- Involve experts in estimating task durations to get accurate timeframesThe final step is to
- Update estimates regularly as new information becomes availableanalyse and prioritise the causes
- Use PERT in conjunction with CPM for a comprehensive schedule analysis. Evaluate each potential cause in terms of its impact on the problem. Use techniques such as voting or ranking to identify the most critical causes for further investigation. Focusing on these key factors will help in developing targeted and effective solutions.
- Leverage software tools for PERT calculations and visualisations.Practical applications and case studies
Common pitfallsReal-world applications of fishbone diagrams
- Overreliance on extreme (optimistic or pessimistic) estimatesFishbone diagrams are widely used across various industries to identify and resolve complex issues. In
- Neglecting task dependenciesmanufacturing
- Failing to update analysis as the project progresses, these diagrams help pinpoint inefficiencies in production processes, leading to improved efficiency and reduced waste. By systematically analysing potential causes, manufacturers can address issues such as equipment malfunctions or material defects.
- Misinterpreting results as definitive rather than probabilistic.In the
PERT can be time-consuming to apply to large projects, and it may not be necessary for every project. It is most useful when used judiciously, in combination with other techniques, and applied to the most critical or highly uncertain aspects of a project.healthcare
Kanban boards sector, fishbone diagrams are instrumental in enhancing patient safety and care quality. They allow healthcare professionals to identify factors contributing to medical errors or delays in treatment, leading to better patient outcomes.
Kanban BoardsIn the are a visual project management tool that originated in Toyota’s lean manufacturing system and have since become popular in various industries, particularly in software development and serviceAgile project industry, companies employ fishbone diagrams to improve customer satisfaction. By analysing complaints and service delivery processes, businesses can identify root causes of customer dissatisfaction and implement effective solutions. This results in enhanced service quality and customer loyalty.managementCase studies showcasing success.Several organisations have successfully employed fishbone diagrams to tackle complex challenges. A notable example is a
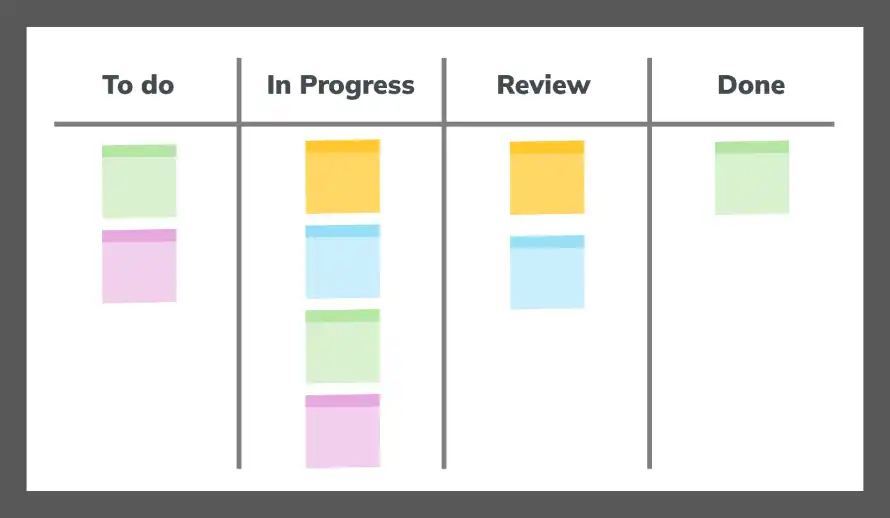
A Kanban board is a visual tool that helps teams manage their work using Kanban methodology. The board is divided into columns that represent the stages of a workflow, for example, “To Do”, “In Progress”, and “Done”. Cards or sticky notes are placed on the board to represent the work items or tasks, and they are moved from one column to another as the work progresses. This way, the team can:manufacturing company
- Visualise workflow: The status of all tasks is visible at a glance. that faced frequent production line stoppages. By using a fishbone diagram, the team identified multiple contributing factors, including outdated machinery and insufficient staff training. Addressing these issues led to a significant reduction in downtime and increased productivity.
- Limit work in progress: Limits are set on the number of tasks in each column to avoid overloading the team.In
- Manage flow: Blockers are quickly identified and resolved.healthcare
- Continuous improvement: The team optimises the workflow over time., a hospital used fishbone diagrams to analyse the root causes of high patient waiting times. The analysis revealed several factors, such as inefficient scheduling and understaffed departments. Implementing targeted solutions based on these findings resulted in reduced waiting times and improved patient satisfaction.
Benefits of using Kanban boards include:A
- Improved transparency and communicationservice company
- Increased focus and productivity dealing with high complaint rates used fishbone diagrams to investigate recurring issues. The analysis highlighted problems such as inadequate staff training and poor communication channe
- Flexibility to adapt to changing priorities
- Reduced waste of time and resources.
Kanban boards can be physical or digital. A physical board can be as simple as a whiteboard and some sticky notes. A digital board is a virtual representation of the physical board that can be accessed and updated by the team members using project management softwarels. By addressing these root causes, the company successfully reduced complaints and improved overall service quality. These case studies demonstrate the effectiveness of fishbone diagrams in solving real-world problems across diverse sectors.. Digital boards offer more features, such as automatic updates, task details, and integration with other tools.Common challenges and solutions
Implementing Kanban boards is easy, but it requires the team to be committed to updating the board regularly and following the work-in-progress limits.Challenges in using fishbone diagrams
Risk and stakeholder managementWhile fishbone diagrams are valuable tools, they are not without challenges. One typical obstacle is
Risk management matrixincomplete cause identification
A . Teams may overlook significant factors due to limited brainstorming or narrow focus areas. Another common issue is Risk Management Matrixcategory overlap, also referred to as a Probability and Impact Matrix, is a graphical representation used in project management to prioritise and manage risks. It allows project managers and teams to evaluate potential risks based on their likelihood of occurrence and potential impact on the project., where causes are placed in multiple categories, leading to confusion and redundancy. These challenges can hinder the effectiveness of the diagram and compromise the analysis.
The matrix typically displays a grid with probability on one axis and impact on the other. Risks are plotted on this grid, enabling quick visual identification of high-priority risks that require immediate attention and action.Solutions and best practices
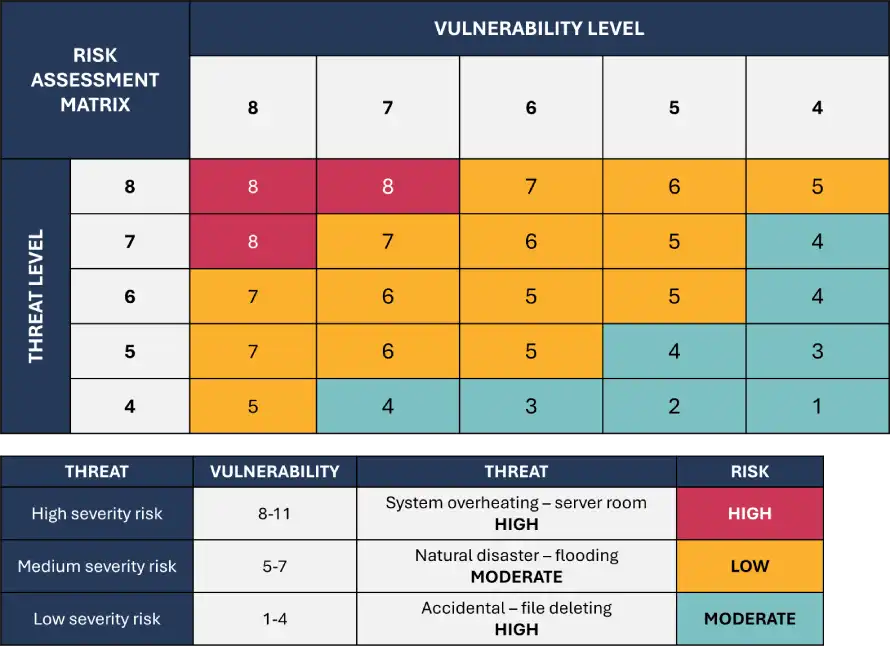
Essential elements in a Risk Management Matrix:To overcome these challenges, teams should employ several strategies. For
- Probability: The chance of a risk happening (typically rated as low, medium, high)comprehensive cause identification
- Impact: The severity of the outcome if the risk occurs (usually ranked from minor to major), include team members from different departments in the brainstorming process. This ensures a broad range of perspectives and reduces the likelihood of missing critical causes. To address
- Risk score: A value obtained by multiplying the probability and impact assessments.category overlap
Advantages of employing a Risk Management Matrix:, establish clear definitions for each category before starting the analysis. This clarity helps in appropriately categorising causes and minimises redundancy. Additionally, regular reviews of the diagram during the analysis process can help identify and rectify any overlaps or omissions, enhancing the diagram’s overall effectiveness.
- Facilitates a clear, visual summary of potential project risks.FAQs
- Assists in prioritising risk responses.How do fishbone diagrams differ from other problem-solving tools?
- Improves risk communication with stakeholders.Fishbone diagrams make it easier to see all possible causes of a problem by sorting them into clear categories. This visual organisation helps teams spot patterns and connections.
- Aids in making more informed decisions.How can I use fishbone diagrams for personal problems?
Tips for effective use:Create categories relevant to your personal challenge, such as daily habits, environment, and relationships. Then list potential causes under each category to understand what’s affecting your situation.
- Update the matrix regularly as new risks emerge or situations evolve.What software tools can assist in creating fishbone diagrams?
- Engage the whole project team in risk identification and evaluation.Microsoft Visio offers professional templates, while Lucidchart and Canva provide user-friendly online options with drag-and-drop features.
- Formulate specific mitigation or contingency plans for prioritised risks.How often should a fishbone diagram be revisited?
- Periodically review and revise risk ratings and assumptions.Review your diagram monthly, when new problems arise, or when you make major changes to your process or team.
By systematically identifying, evaluating, and addressing risks, Are there any limitations to using fishbone diagrams?project managersFishbone diagrams work well for identifying causes but may not show how strongly each cause affects the problem. They also rely on your team’s knowledge to be effective. can proactively manage potential challenges and opportunities, thereby enhancing the project’s chances of success.Infographic
Stakeholder mappingSubscribe to our exclusive offers and promotions
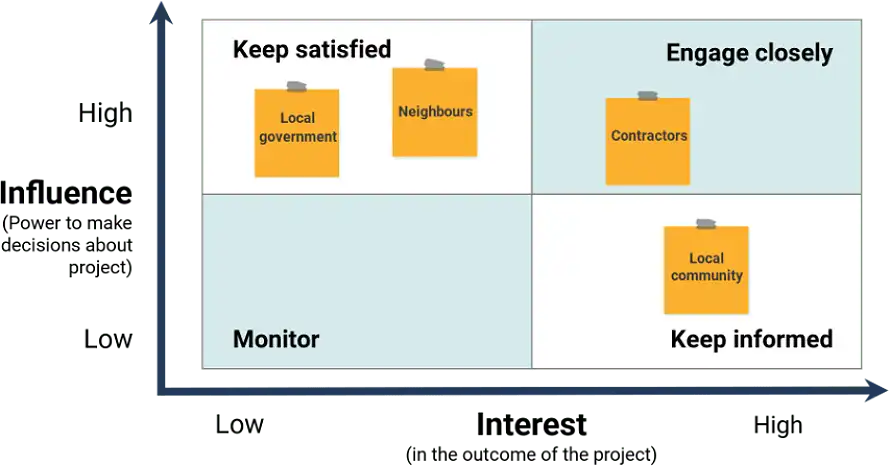
Stakeholder mapping is a visual technique to analyse and prioritise stakeholders for your project based on their interest, influence, and impact on the project.Subscribe now
Key takeaways
- Recognise all potential stakeholders, those who may affect or be affected by the project.
- Help prioritise stakeholders based on their influence and interest in the project.{"@context":"https://schema.org","@type":"ImageObject","contentUrl":"https://www.knowledgetrain.co.uk/training-courses/fishbone-diagrams-business-analysis-technique-890x501.webp","description":"PRINCE2 Careers","license":"https://www.knowledgetrain.co.uk/license","acquireLicensePage":"https://www.knowledgetrain.co.uk/license","creditText":"Knowledge Train","uploadDate":"2023-05-16T06:50:34.000Z","copyrightNotice":"© 2023 Knowledge Train Limited. All rights reserved.","creator":{"@type":"Organization","name":"Knowledge Train","url":"https://www.knowledgetrain.co.uk"}}
- Facilitate communication planning with stakeholders.
- Aid in {"@context":"https://schema.org","@type":"ImageObject","contentUrl":"https://www.knowledgetrain.co.uk/training-courses/res/images/business-analysis/fishbone-diagrams-business-analysis-technique-infographic-800x3120.webp","description":"Fishbone diagrams business analysis technique infographic.","license":"https://www.knowledgetrain.co.uk/license","acquireLicensePage":"https://www.knowledgetrain.co.uk/license","creditText":"Knowledge Train","uploadDate":"2023-05-16T06:50:34.000Z","copyrightNotice":"© 2023 Knowledge Train Limited. All rights reserved.","creator":{"@type":"Organization","name":"Knowledge Train","url":"https://www.knowledgetrain.co.uk"}}risk management and informed decision making.Related articles
Quick tips
- Use a power/interest grid to plot stakeholders.
- Update the stakeholder map regularly as the project evolves.
- Identify both positive and negative stakeholders.
- Customise communication plans for different stakeholder groups.
- Engage team members in the mapping process for a broader view.
Common pitfalls
- Missing less apparent stakeholders.
- Not reassessing stakeholder positions over time.
- Ignoring low-power stakeholders.
- Overlooking the need for individual engagement strategies.
- Assuming stakeholders’ interests do not change.
Project success can be achieved by carefully identifying and communicating with key project stakeholders. The concept of a stakeholder map can be explained as the graphical representation of project stakeholders. The process to be performed for conducting a stakeholder mapping analysis is very crucial for the project success. When starting with a new project, the first phase in stakeholder mapping analysis is to conduct a stakeholder identification process. The stakeholder identification process in a project involves categorising the identified stakeholders based on their impact on the project and their level of influence in the project.
Financial and resource management
Earned Value Management (EVM)
Earned Value Management (EVM) is a project management technique that uses scope, schedule, and cost data to assess a project’s progress and performance. It integrates scope, schedule, and cost measures to provide a comprehensive view of the project’s health. EVM compares the planned work with the actual completed work and the actual costs incurred, offering insights into both the status and future projections of the project.
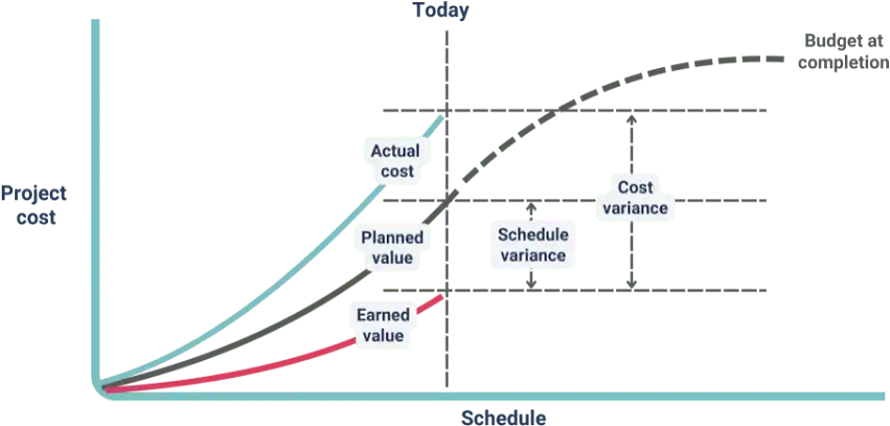
The key components of EVM are:Business analyst certification: What it is and how to get certified
- Planned Value (PV): The budgeted cost of work scheduled to be done
- Earned Value (EV): The budgeted cost of work performedSimon Buehring
- Actual Cost (AC): The actual cost incurred for work performed.30 Apr 2026
EVM is used to compute the following metrics:
- Schedule Variance (SV) = EV – PVDiscover the essentials of business analyst certification, from leading qualification types to preparation, costs, and career benefits. Start your path to professional recognition and new business analysis opportunities.
- Cost Variance (CV) = EV – AC
- Schedule Performance Index (SPI) = EV / PV
- Cost Performance Index (CPI) = EV / AC
Key takeaways
- Offers early warning signs for potential project performance issues
- Allows for accurate prediction of project costs and completion dates
- Facilitates data-driven decision making.
Quick tipsYou want to become a business analyst?
- Set a clear project baseline before implementing EVM
- Utilise Simon Buehringproject management software19 Feb 2026 to automate EVM calculations
- Regularly review and analyse EVM metricsDiscover different motivations for pursuing a career as a business analyst. Learn what drives BA professionals by reading more.
- Effectively communicate EVM results to stakeholders.
Common pitfalls
- Using EVM in a rigid way without understanding the context and qualitative issues
- Using EVM without adequate training or knowledge
- Not revising the baseline for significant changes
- Not acting based on the EVM information.
Cost-benefit analysis
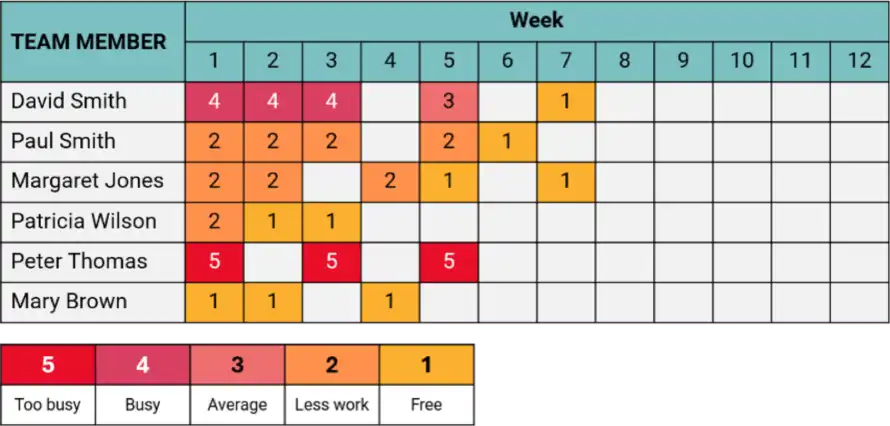
- Simon BuehringFailing to update the resource levelling as the project progresses.
- Overlooking the impact of resource levelling on project costs.19 Feb 2026
Conclusion
Project managersLearn how BCS Business Analysis qualifications can enhance your career. Align your skills with industry benchmarks by scrolling down. can add the project management techniques described in this article to their project management toolkits. The larger the toolkit, the better equipped they are to handle the challenges their projects throw at them.
Project managers who effectively implement these techniques can improve their project plans , resource scheduling, time and cost management, risks and stakeholders’ management and project performance.
Informed decisions and right use of these techniques can help project managers deliver better project outcomes.
