The Work Breakdown Structure (WBS) is a project management technique that involves breaking down a project into smaller, more manageable components. It is a hierarchical decomposition of the total scope of work and provides a visual representation of all the tasks required to complete a project.The technical storage or access is strictly necessary for the legitimate purpose of enabling the use of a specific service explicitly requested by the subscriber or user, or for the sole purpose of carrying out the transmission of a communication over an electronic communications network.
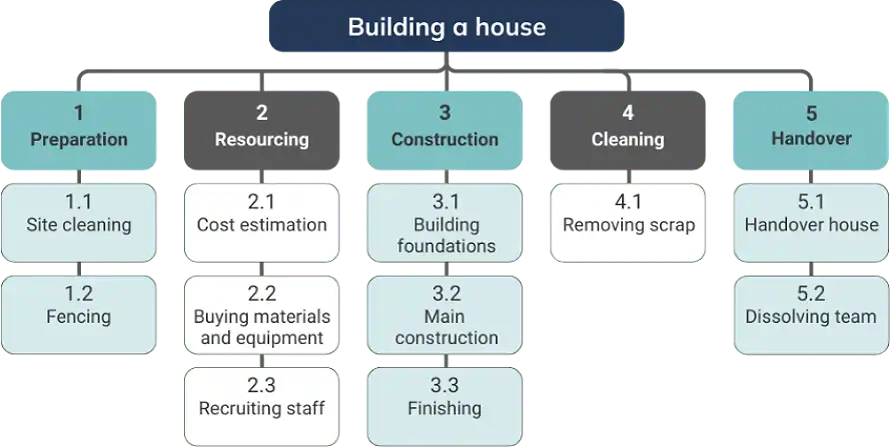
The essence of a WBS is to break down the final deliverable into smaller, more manageable components called work packages. It starts with the final deliverable at the top and is subdivided in a tree structure, where each level of detail represents an increasingly granular level of the project components. These components are typically organised into phases, deliverables, and work packages. By definition, WBS becomes more detailed as you go deeper into the tree. In project management , WBS is used to:
- Define and organise the total scope of a project
- Ensure all the work required is included, and nothing outside the scope is addedPreferences
- Create a foundation for estimating costs, duration, and resources
- Assign responsibilities to team members
- Develop a project schedulePreferences and budget.
Developing a WBS typically requires input from the project team and stakeholders to ensure it is comprehensive and accurate. A WBS is usually presented as a tree diagram or outline, with each level representing an increased level of detail and each item on the same level representing a similar type of work. Note that the term ‘tree’ is used by many software systems and it is not necessarily drawn as a tree.
A WBS becomes the foundation for other project management processes , including risk assessment, task assignments, and progress tracking. It helps the project team to provide a common structure for the whole project, and other details and activities are based on the work breakdown structure.
Gantt chartsThe technical storage or access is necessary for the legitimate purpose of storing preferences that are not requested by the subscriber or user.
Gantt charts are one of the most widely used and recognised project management techniques. They provide a visual timeline for the project and can display the relationships and dependencies between different tasks or activities. Gantt charts have a long history, with their use dating back to the early 1900s when they were popularised by Henry Gantt, a mechanical engineer and management consultant. In recent years, Gantt charts have transitioned from physical, hand-drawn charts to digital project management tools.
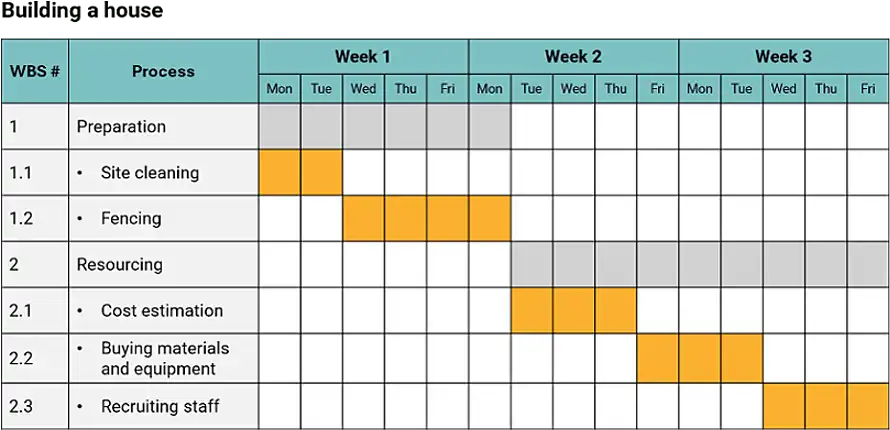
A Gantt chart typically consists of a horizontal bar chart with the project tasks listed on the vertical axis on the left side and the time periods spread across the top. The project tasks are then represented by horizontal bars spanning the time periods in which they are scheduled to be performed. The length of the bar indicates the duration of each task. This format allows project managers and team members to:Statistics
- Clearly visualise the project timeline and the duration of each task
- Identify dependencies and relationships between tasks
- Track progress against the planned schedule
- Allocate resources to tasksStatistics
- Communicate the project timelines to stakeholders.
Some modern Gantt chart software provides additional features such as colour-coding of tasks, milestone markers, and linking of dependent tasks. Some tools also allow for resource allocation and workload management directly from the Gantt view.
Gantt charts are most useful when you want to provide an overview of the entire project. However, for large and complex projects, they may become cluttered and difficult to read. Despite this, Gantt charts remain a popular tool for project managers because of their intuitive design and ability to communicate complex scheduling information quickly and clearly.
Project network diagrams
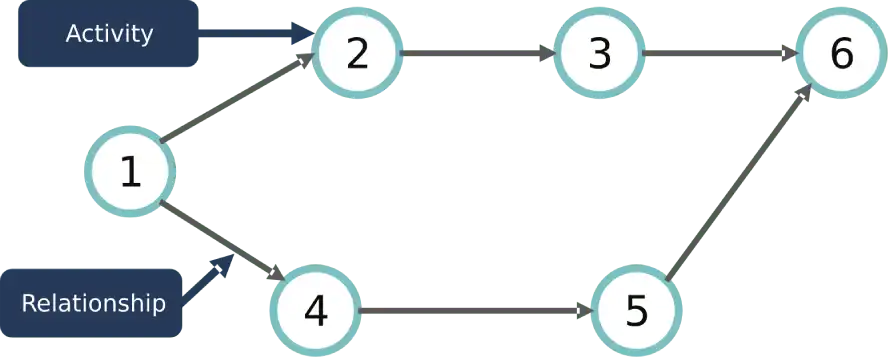
Project Network Diagrams , as the name implies, are graphical representations of a project’s tasks and their relationships, showing how the project activities are sequenced and interrelated. These diagrams provide a visual depiction of the project flow and are commonly used in project management methodologies that include Critical Path Method (CPM) and Program Evaluation and Review Technique (PERT).
Network diagrams typically use nodes to represent tasks or activities and arrows to indicate dependencies between these tasks. They allow for a clear visualisation of task sequences and can help project managers identify potential bottlenecks or critical paths in the project scheduleThe technical storage or access that is used exclusively for statistical purposes. .
Key takeawaysThe technical storage or access that is used exclusively for anonymous statistical purposes. Without a subpoena, voluntary compliance on the part of your Internet Service Provider, or additional records from a third party, information stored or retrieved for this purpose alone cannot usually be used to identify you.
- Visual representation of task dependencies
- Identify critical path and potential schedule risks
- Facilitate resource allocation and schedule optimisation.
Quick tips
- Begin with a clear list of all project tasks and their dependencies.
- Use software tools for easy creation and updating of network diagrams. Marketing
- Regularly review and update the diagram as the project progresses.
- Utilise color-coding to highlight critical paths or high-risk activities.
Common pitfalls
- Overlooking important task dependencies. Marketing
- Creating overly complex diagrams that are difficult to understand.
- Failing to update the diagram as project scope or timelines change.
- Neglecting to consider resource constraints when analysing the network.
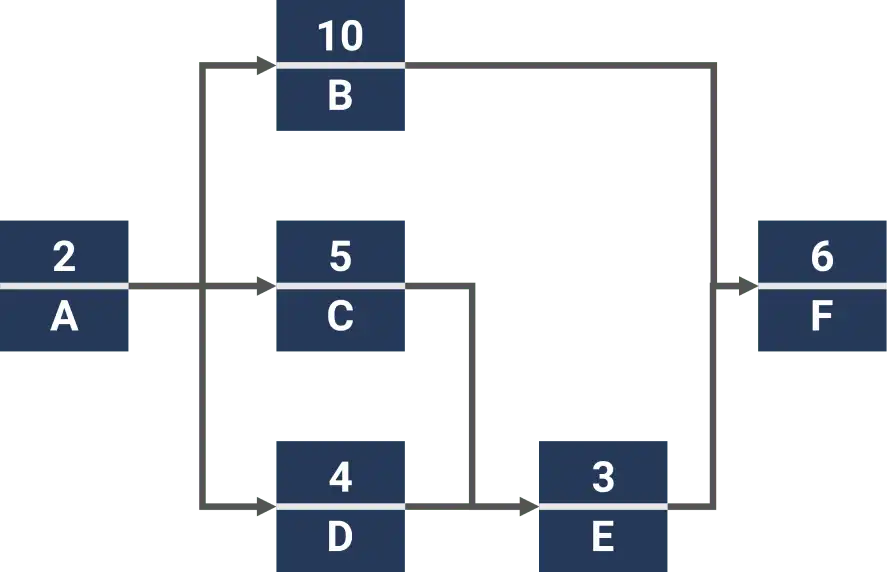
ls can also integrate with other techniques like Gantt charts and resource levelling.
While CPM is well-suited for projects with well-defined tasks and dependencies, it may be less effective for projects with high levels of uncertainty or frequent changes. In such cases, it’s often used in conjunction with other techniques, such as PERT or