Using fishbone diagrams effectively in your projectsPhone

- Define a precise problem statement first, as it determines the focus and usefulness of the analysis.
- Brainstorm widely with cross-functional characters to reduce blind spots and incomplete cause lists. Request a quote
- Group causes into clear categories, using standard headings or custom ones that fit your context.
- Review the diagram during the session to catch overlaps, duplicates, and missing factors early.
- Prioritise likely high-impact causes using simple ranking or voting before investigating solutions.

Introduction to fishbone diagrams

What is a fishbone diagram?
A United Kingdomfishbone diagramAustria, also known as an BelgiumIshikawa diagramBulgaria or a cause-and-effect diagram, is a fundamental tool in Croatiaquality managementCyprus. Named after its creator, Kaoru Ishikawa, this diagram helps in identifying root causes of a problem by organising potential causes into useful categories. The visual structure resembles a fish skeleton, with the problem statement at the ‘head’ and contributing factors branching off as ‘bones.’ This structured approach facilitates effective brainstorming sessions, enabling teams to explore a wide range of possible causes systematically.Czech Republic
Importance in problem-solvingDenmark
Fishbone diagrams are vital in quality management and continuous improvement efforts across numerous industries. They are one of the Seven Basic Quality Tools, essential for identifying and resolving issues efficiently. The diagrams help teams develop specific solutions and are particularly valuable inEstonia
- Manufacturing sectorsFinland use them to identify and address production process inefficienciesFrance
- Healthcare organisationsGermany use them to improve patient care by analysing procedural issuesGreece
- Service industriesIreland use them to enhance customer satisfaction by resolving service concerns.Italy
In essence, fishbone diagrams not only aid in identifying the root causes of problems but also promote a culture of systematic analysis and continuous improvement. By applying this method, organisations can ensure that they address issues comprehensively, leading to more effective and lasting solutions.Latvia
Understanding fishbone diagram componentsLithuania
Basic structure of a fishbone diagramLuxemburg
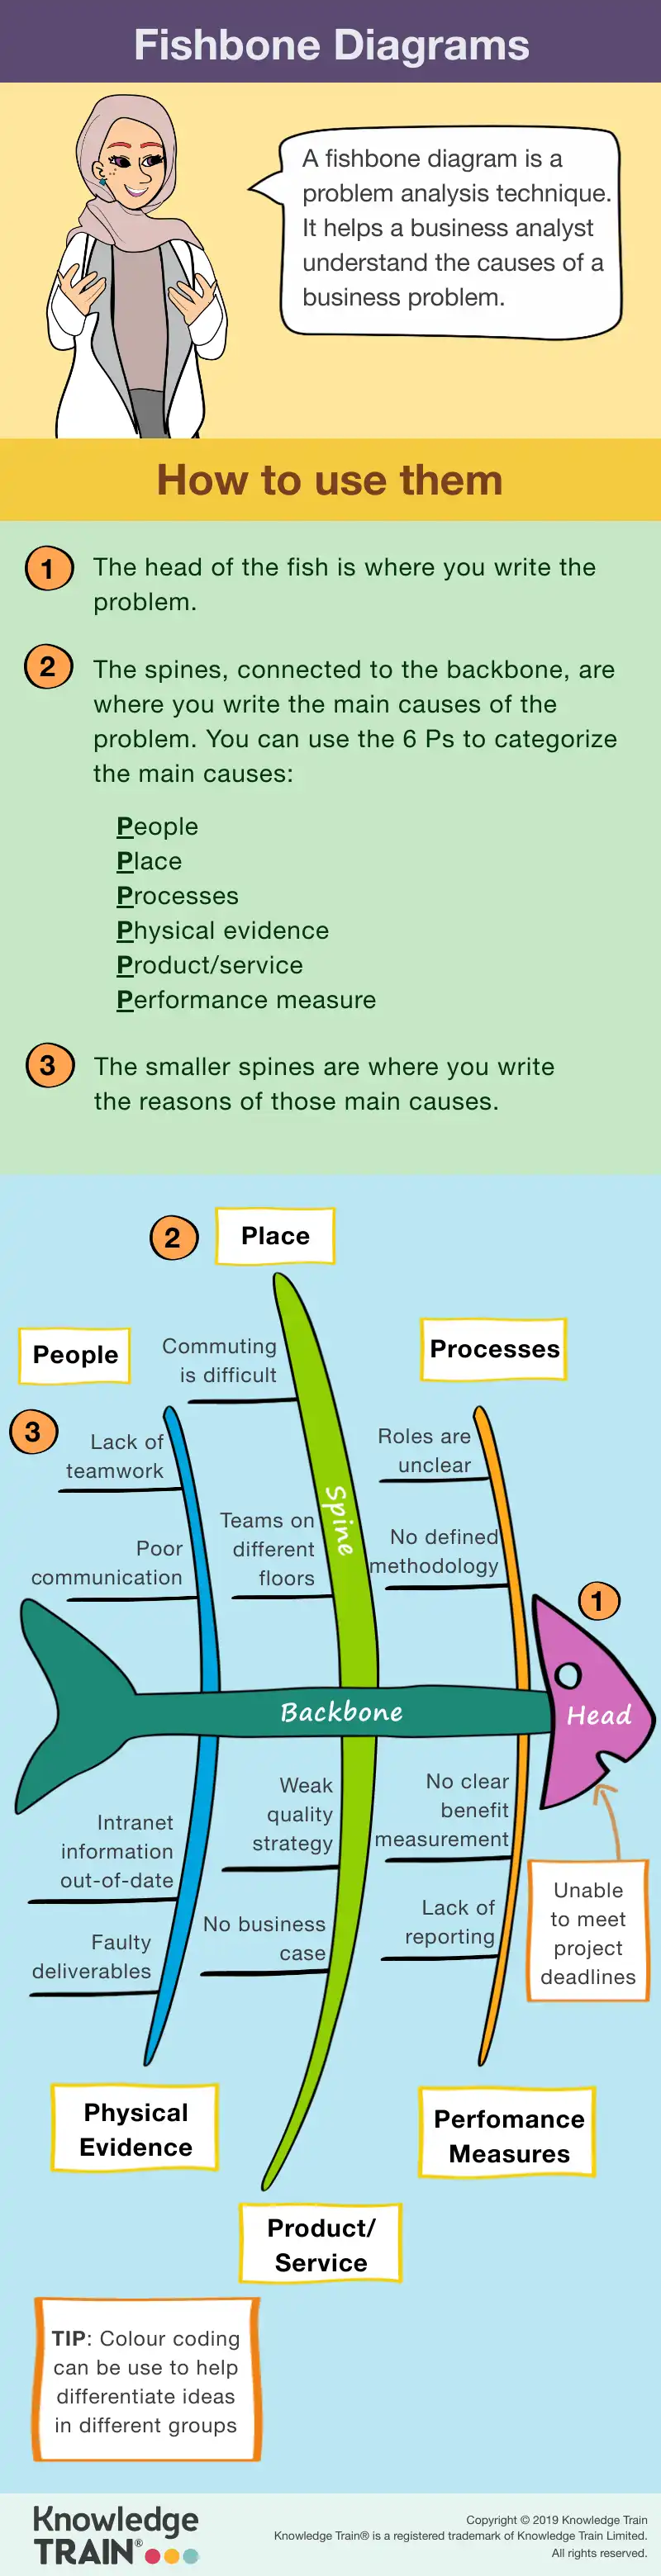
A Maltafishbone diagramNetherlands is a visual tool that helps teams identify and categorise the root causes of a problem. The diagram resembles the skeleton of a fish, making it intuitive and straightforward to use. At the ‘head’ of the diagram, you place the Polandproblem statementPortugal – the issue that needs addressing. This serves as the focal point of the analysis.Romania
Branching off from the spine are the ‘bones,’ which represent potential SlovakiacausesSlovenia of the problem. These are organised into various categories, allowing teams to explore different angles of the issue systematically. Each ‘bone’ signifies a distinct cause or factor, and further branching can detail sub-causes. This structured layout not only clarifies complex problems but also encourages comprehensive brainstorming and analysis.Spain
Categories in fishbone diagramsSweden
Standard categoriesOther countries
Fishbone diagramsHome often use standard categories to organise potential causes, especially in Business Analysisquality managementBusiness analyst course and engineering contexts. These categories help ensure a comprehensive analysis by covering different aspects of the problem. Commonly used categories include:Business analysis technique McKinsey 7s Model
- Methods : Processes or procedures that might contribute to the issue{"@context":"http://schema.org","@type":"BreadcrumbList","itemListElement":[{"@type":"ListItem","position":1,"name":"Home","item":"https://www.knowledgetrain.co.uk/"},{"@type":"ListItem","position":2,"name":"Business Analysis","item":"https://www.knowledgetrain.co.uk/business-analysis"},{"@type":"ListItem","position":3,"name":"Business analyst course","item":"https://www.knowledgetrain.co.uk/business-analysis/business-analyst-course"},{"@type":"ListItem","position":4,"name":"Business analysis technique McKinsey 7s Model","item":"https://www.knowledgetrain.co.uk/business-analysis/business-analyst-course/business-analysis-technique-mckinsey-7s-model"}]}
- Materials : Raw materials or components involved in the process
- Machines : Equipment or tools used, which might have faults or limitationsExploring the impact of the McKinsey 7S model on organisational performance
- Manpower : Human factors, such as skills, training, or motivationSimon Buehring
- Measurements3 Mar 2026: Data or metrics that might be inaccurate or misleading
- Environment : External conditions or settings that could affect outcomes.
These categories offer teams a structured approach to explore potential causes.
Custom categories
While standard categories are useful, organisations often benefit from tailoring categories to their specific needs or industries. Custom categories allow teams to focus on the unique aspects of their problem domain. For instance, a software development team might include categories like user experience or software architecture . Meanwhile, a retail business might focus on customer feedback or
Fishbone diagram variations and proceduresIntroduction to McKinsey 7S
Variations of the fishbone diagram
Fishbone diagrams come in several variations, each designed to suit specific analytical needs. These nuanced versions adapt the basic structure to address particular types of problems or sectors. For instance, some organisations may opt for a The 7 elements simple fishbone diagram without predetermined categories. This approach allows teams to define categories that are most relevant to their context, promoting flexibility in analysis.Implementing McKinsey 7S
Other variations may incorporate additional layers of complexity. For example, a complex fishbone diagramApplications might include sub-categories or integrate quantitative data to enhance the depth of analysis. These variations are particularly useful in industries that require detailed scrutiny, such as engineering or pharmaceuticals. By tailoring the diagram to specific needs, teams can ensure a more precise and effective root cause analysis.
Real-world applications of fishbone diagrams
Hard elementsmanufacturing companyThe McKinsey 7S Model comprises three hard elements that are more easily identifiable and manageable: that faced frequent production line stoppages. By using a fishbone diagram, the team identified multiple contributing factors, including outdated machinery and insufficient staff training. Addressing these issues led to a significant reduction in downtime and increased productivity.Strategy
In : This element outlines how the organisation plans to achieve its long-term objectives and how it allocates its resources to implement these plans. An effective strategy aligns with the company’s mission and adapts to changing market conditions. It guides decision-making processes and resource allocation across the organisation.healthcareStructure, a hospital used fishbone diagrams to analyse the root causes of high patient waiting times. The analysis revealed several factors, such as inefficient scheduling and understaffed departments. Implementing targeted solutions based on these findings resulted in reduced waiting times and improved patient satisfaction.: This refers to the organisational hierarchy and how different departments and teams are organised. The structure determines reporting lines, decision-making authority, and communication channels. An optimal structure facilitates efficient operations and supports the implementation of the strategy.
A Systemsservice company: These encompass all procedures, processes, and technologies that support daily operations. Systems include everything from ls. By addressing these root causes, the company successfully reduced complaints and improved overall service quality. These case studies demonstrate the effectiveness of fishbone diagrams in solving real-world problems across diverse sectors.The four
Common challenges and solutionssoft elements
Challenges in using fishbone diagrams are less tangible but equally crucial for organisational success:
While fishbone diagrams are valuable tools, they are not without challenges. One typical obstacle is Shared valuesincomplete cause identification: These are the core principles and beliefs that guide the organisation’s behaviour. Shared values form the foundation of corporate culture and influence decision-making at all levels. They should align with the organisation’s mission and strategy.. Teams may overlook significant factors due to limited brainstorming or narrow focus areas. Another common issue is Skillscategory overlap: This element represents the collective capabilities and expertise of the organisation’s workforce. It includes both technical and soft skills. Continuously developing and aligning skills with strategic objectives is essential for maintaining competitive advantage., where causes are placed in multiple categories, leading to confusion and redundancy. These challenges can hinder the effectiveness of the diagram and compromise the analysis.Style
Solutions and best practices: This refers to the leadership approach and overall organisational culture. The management style influences employee motivation, communication patterns, and decision-making processes. An effective style fosters innovation, collaboration, and high performance.
To overcome these challenges, teams should employ several strategies. For Staffcomprehensive cause identification: This element encompasses human resource management practices, including recruitment, training, and retention strategies. It focuses on ensuring the right people are in the right roles and are properly motivated and developed., include team members from different departments in the brainstorming process. This ensures a broad range of perspectives and reduces the likelihood of missing critical causes. To address Understanding and aligning these seven elements is crucial for achieving organisational effectiveness and successfully implementing change initiatives.category overlapEnhance your skills with our expert-led courses, establish clear definitions for each category before starting the analysis. This clarity helps in appropriately categorising causes and minimises redundancy. Additionally, regular reviews of the diagram during the analysis process can help identify and rectify any overlaps or omissions, enhancing the diagram’s overall effectiveness.