Using fishbone diagrams effectively in your projects



Preferences
- The technical storage or access is necessary for the legitimate purpose of storing preferences that are not requested by the subscriber or user.
The technical storage or access that is used exclusively for statistical purposes.
The technical storage or access that is used exclusively for anonymous statistical purposes. Without a subpoena, voluntary compliance on the part of your Internet Service Provider, or additional records from a third party, information stored or retrieved for this purpose alone cannot usually be used to identify you.
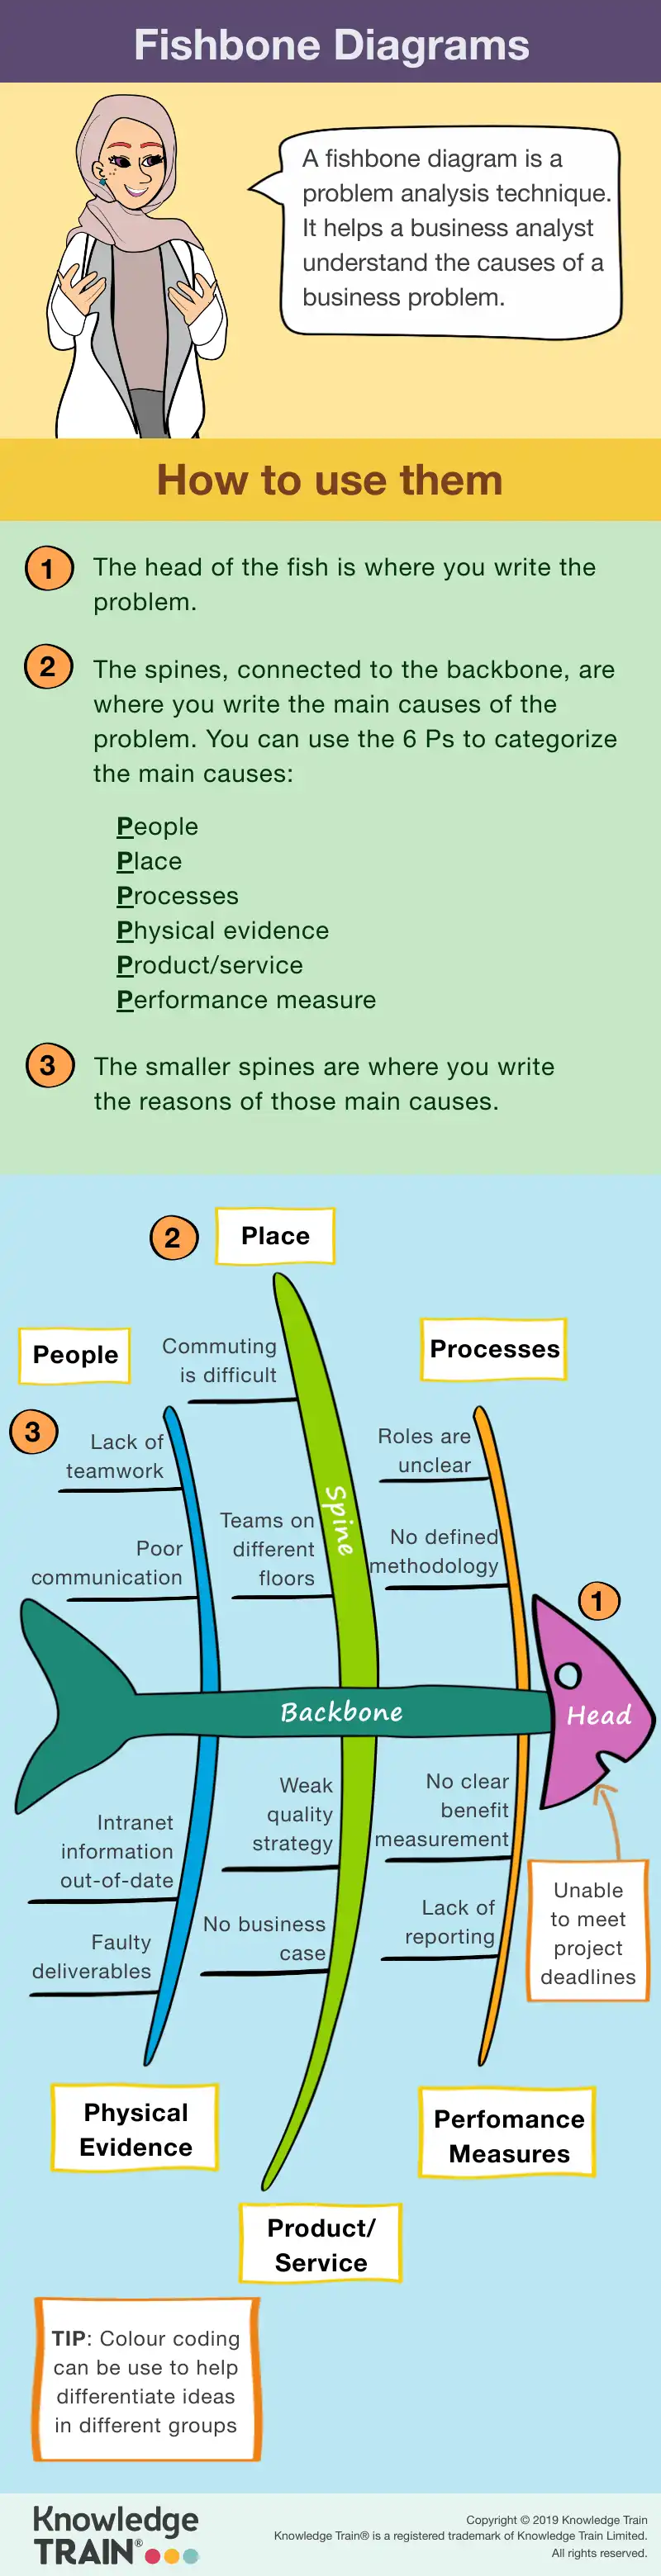
Categorising causes
After brainstorming, organise the identified causes into relevant categories . These categories can be standard ones like Methods, Materials, and Manpower, or custom ones tailored to your specific context. Proper categorisation helps in visualising the problem from different angles and ensures no potential cause is overlooked.
Analysing and prioritising causes
The final step is to analyse and prioritise the causes . Evaluate each potential cause in terms of its impact on the problem. Use techniques such as voting or ranking to identify the most critical causes for further investigation. Focusing on these key factors will help in developing targeted and effective solutions.
Practical applications and case studies
Real-world applications of fishbone diagrams
Fishbone diagrams are widely used across various industries to identify and resolve complex issues. In manufacturing , these diagrams help pinpoint inefficiencies in production processes, leading to improved efficiency and reduced waste. By systematically analysing potential causes, manufacturers can address issues such as equipment malfunctions or material defects.
In the healthcare
How can I use fishbone diagrams for personal problems?
Create categories relevant to your personal challenge, such as daily habits, environment, and relationships. Then list potential causes under each category to understand what’s affecting your situation.
What software tools can assist in creating fishbone diagrams?
Microsoft Visio offers professional templates, while Lucidchart and Canva provide user-friendly online options with drag-and-drop features.
How often should a fishbone diagram be revisited?
Review your diagram monthly, when new problems arise, or when you make major changes to your process or team.
Are there any limitations to using fishbone diagrams?
Fishbone diagrams work well for identifying causes but may not show how strongly each cause affects the problem. They also rely on your team’s knowledge to be effective.
Infographic