>Introduction to fishbone diagrams

>What is a fishbone diagram?<
Understanding fishbone diagram components24 Sep - 25 Sep
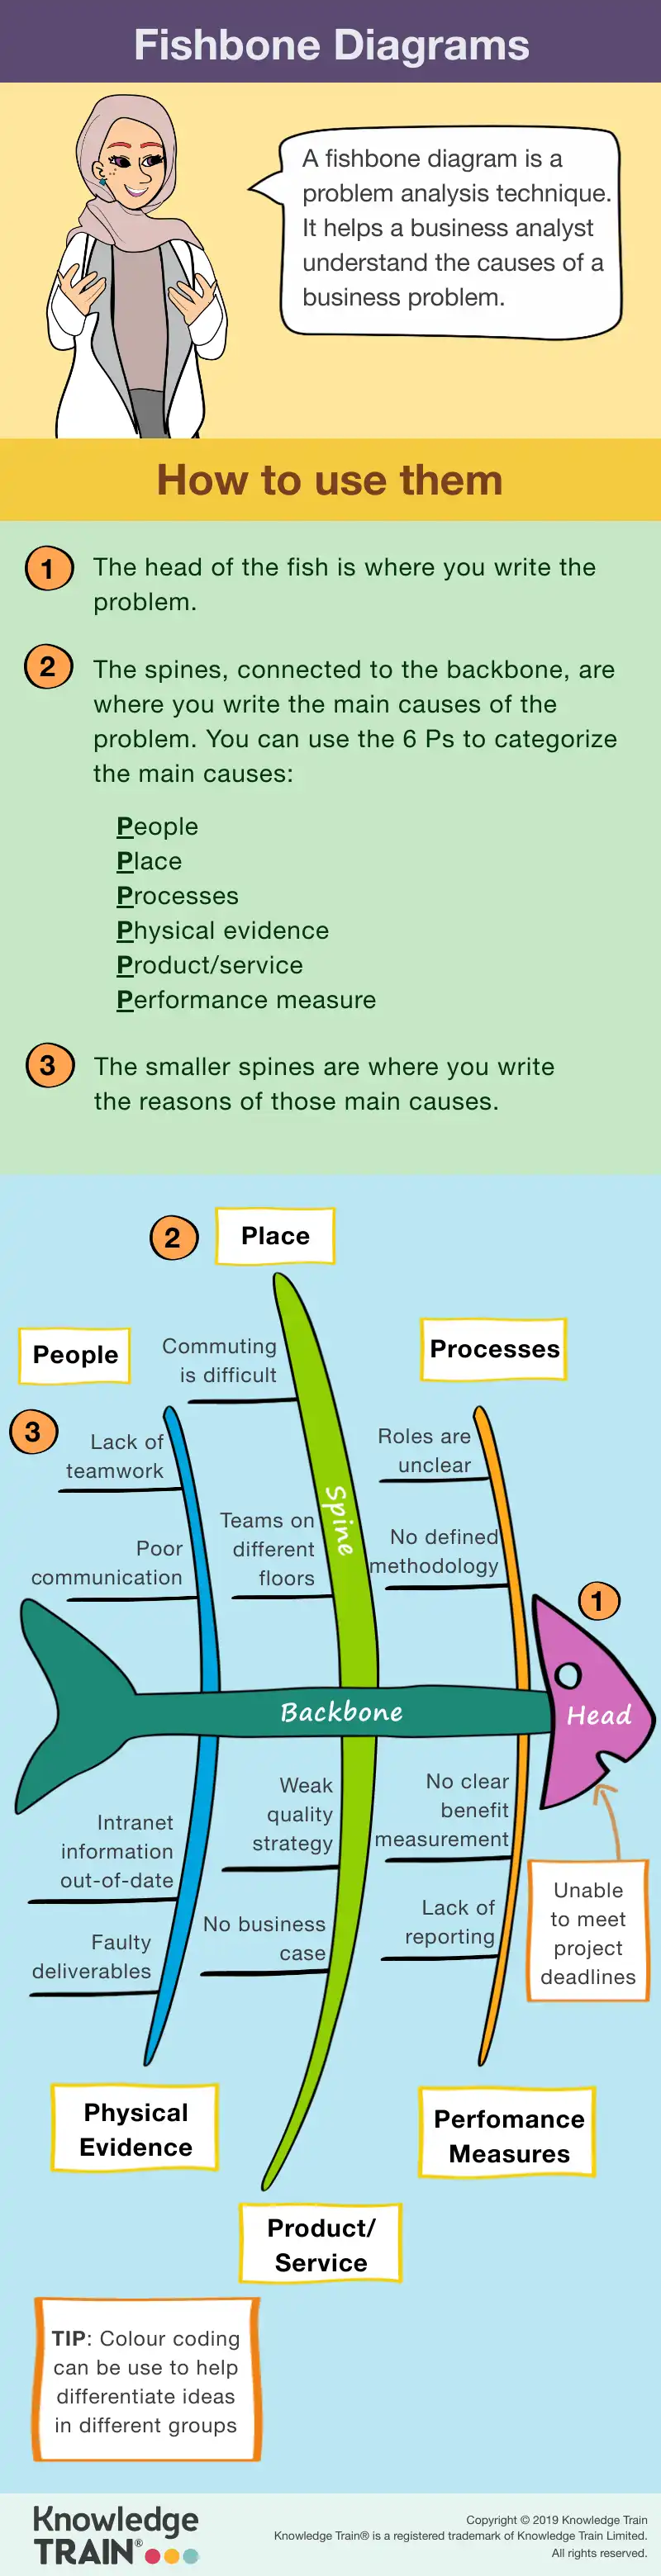
Basic structure of a fishbone diagram
A Change Management Practitioner course (Online)fishbone diagram is a visual tool that helps teams identify and categorise the root causes of a problem. The diagram resembles the skeleton of a fish, making it intuitive and straightforward to use. At the ‘head’ of the diagram, you place the £1,359problem statement – the issue that needs addressing. This serves as the focal point of the analysis.Enrol now
causes of the problem. These are organised into various categories, allowing teams to explore different angles of the issue systematically. Each ‘bone’ signifies a distinct cause or factor, and further branching can detail sub-causes. This structured layout not only clarifies complex problems but also encourages comprehensive brainstorming and analysis.
Categories in fishbone diagrams{"@context":"http://schema.org","@type":"EducationEvent","name":"Change Management Practitioner course","startDate":"2026-09-24","endDate":"2026-09-25","description":"Change Management Practitioner course","url":"https://www.knowledgetrain.co.uk/change-management/change-management-courses/apmg-change-management-course/change-management-practitioner","eventStatus":"EventScheduled","eventAttendanceMode":"OnlineEventAttendanceMode","audience":{"@type":"Audience","name":"
<: Processes or procedures that might contribute to the issuespan>Those performing key roles in the design, development, and delivery of organisational change programmes <: Equipment or tools used, which might have faults or limitationsspan>Change project managers <: Data or metrics that might be inaccurate or misleadingspan>Transformation managers
Senior responsible owners
< or li>
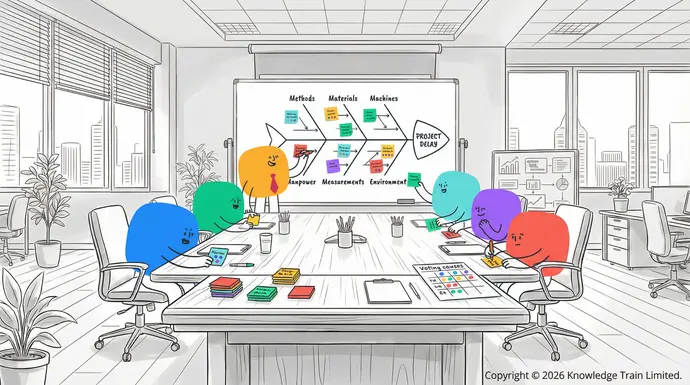
analyse and prioritise the causesEnrol now. Evaluate each potential cause in terms of its impact on the problem. Use techniques such as voting or ranking to identify the most critical causes for further investigation. Focusing on these key factors will help in developing targeted and effective solutions.
Practical applications and case studies
Real-world applications of fishbone diagrams
Fishbone diagrams are widely used across various industries to identify and resolve complex issues. In manufacturing{"@context":"http://schema.org","@type":"EducationEvent","name":"Change Management Practitioner (with Foundation) course","startDate":"2026-10-19","endDate":"2026-10-23","description":"Change Management Practitioner (with Foundation) course","url":"https://www.knowledgetrain.co.uk/change-management/change-management-courses/apmg-change-management-course/change-management-practitioner","eventStatus":"EventScheduled","eventAttendanceMode":"OnlineEventAttendanceMode","audience":{"@type":"Audience","name":"<, these diagrams help pinpoint inefficiencies in production processes, leading to improved efficiency and reduced waste. By systematically analysing potential causes, manufacturers can address issues such as equipment malfunctions or material defects.ul>
<, a hospital used fishbone diagrams to analyse the root causes of high patient waiting times. The analysis revealed several factors, such as inefficient scheduling and understaffed departments. Implementing targeted solutions based on these findings resulted in reduced waiting times and improved patient satisfaction.li>
"},"aggregateRating":{"@type":"AggregateRating","ratingValue":"4.8","reviewCount":"227"},"location":{"@type":"VirtualLocation","url":"https://www.knowledgetrain.co.uk/change-management/change-management-courses/apmg-change-management-course/change-management-practitioner"},"image":["https://www.knowledgetrain.co.uk/training-courses/res/logos/apmg-change-management-accredited-training-organisation-logo.svg"],"offers":{"@type":"Offer","url":"https://www.knowledgetrain.co.uk/change-management/change-management-courses/apmg-change-management-course/change-management-practitioner","price":"","priceCurrency":"","availability":"http://schema.org/InStock","validFrom":"2026-05-27"},"performer":{"@type":"Person","name":"Susan Tuttle"},"organizer":{"@type":"Organization","name":"Knowledge Train","url":"https://www.knowledgetrain.co.uk/change-management/change-management-courses/apmg-change-management-course/change-management-practitioner"}}
How do fishbone diagrams differ from other problem-solving tools?
Fishbone diagrams make it easier to see all possible causes of a problem by sorting them into clear categories. This visual organisation helps teams spot patterns and connections.
How can I use fishbone diagrams for personal problems?
Create categories relevant to your personal challenge, such as daily habits, environment, and relationships. Then list potential causes under each category to understand what’s affecting your situation.22 Oct - 23 Oct
What software tools can assist in creating fishbone diagrams?
Microsoft Visio offers professional templates, while Lucidchart and Canva provide user-friendly online options with drag-and-drop features.Change Management Practitioner course (Online)
How often should a fishbone diagram be revisited?
Review your diagram monthly, when new problems arise, or when you make major changes to your process or team. £1,359
Are there any limitations to using fishbone diagrams?
Fishbone diagrams work well for identifying causes but may not show how strongly each cause affects the problem. They also rely on your team’s knowledge to be effective.Enrol now
Infographic