Key takeawaysAnyone planning to progress to PRINCE2 Practitioner
Fishbone diagrams help teams move from symptoms to root causes with a clear, shared view of the problem.No prior project management experience required
- Define a precise problem statement first, as it determines the focus and usefulness of the analysis.Benefits
- Brainstorm widely with cross-functional characters to reduce blind spots and incomplete cause lists. Get certified fast
- Group causes into clear categories, using standard headings or custom ones that fit your context.
- Review the diagram during the session to catch overlaps, duplicates, and missing factors early. Complete your training and exam in just 2 days
- Prioritise likely high-impact causes using simple ranking or voting before investigating solutions. Advance your career

Introduction to fishbone diagramsStart date

What is a fishbone diagram?Exam
A Materialsfishbone diagram, also known as an Ishikawa diagram
Fishbone diagrams are vital in quality management and continuous improvement efforts across numerous industries. They are one of the Seven Basic Quality Tools, essential for identifying and resolving issues efficiently. The diagrams help teams develop specific solutions and are particularly valuable in
- Manufacturing sectors use them to identify and address production process inefficienciesInstructor-led
- Healthcare organisations use them to improve patient care by analysing procedural issues
- Service industries use them to enhance customer satisfaction by resolving service concerns.Live sessions (online or classroom)
In essence, fishbone diagrams not only aid in identifying the root causes of problems but also promote a culture of systematic analysis and continuous improvement. By applying this method, organisations can ensure that they address issues comprehensively, leading to more effective and lasting solutions.
Understanding fishbone diagram components2 days
Basic structure of a fishbone diagram
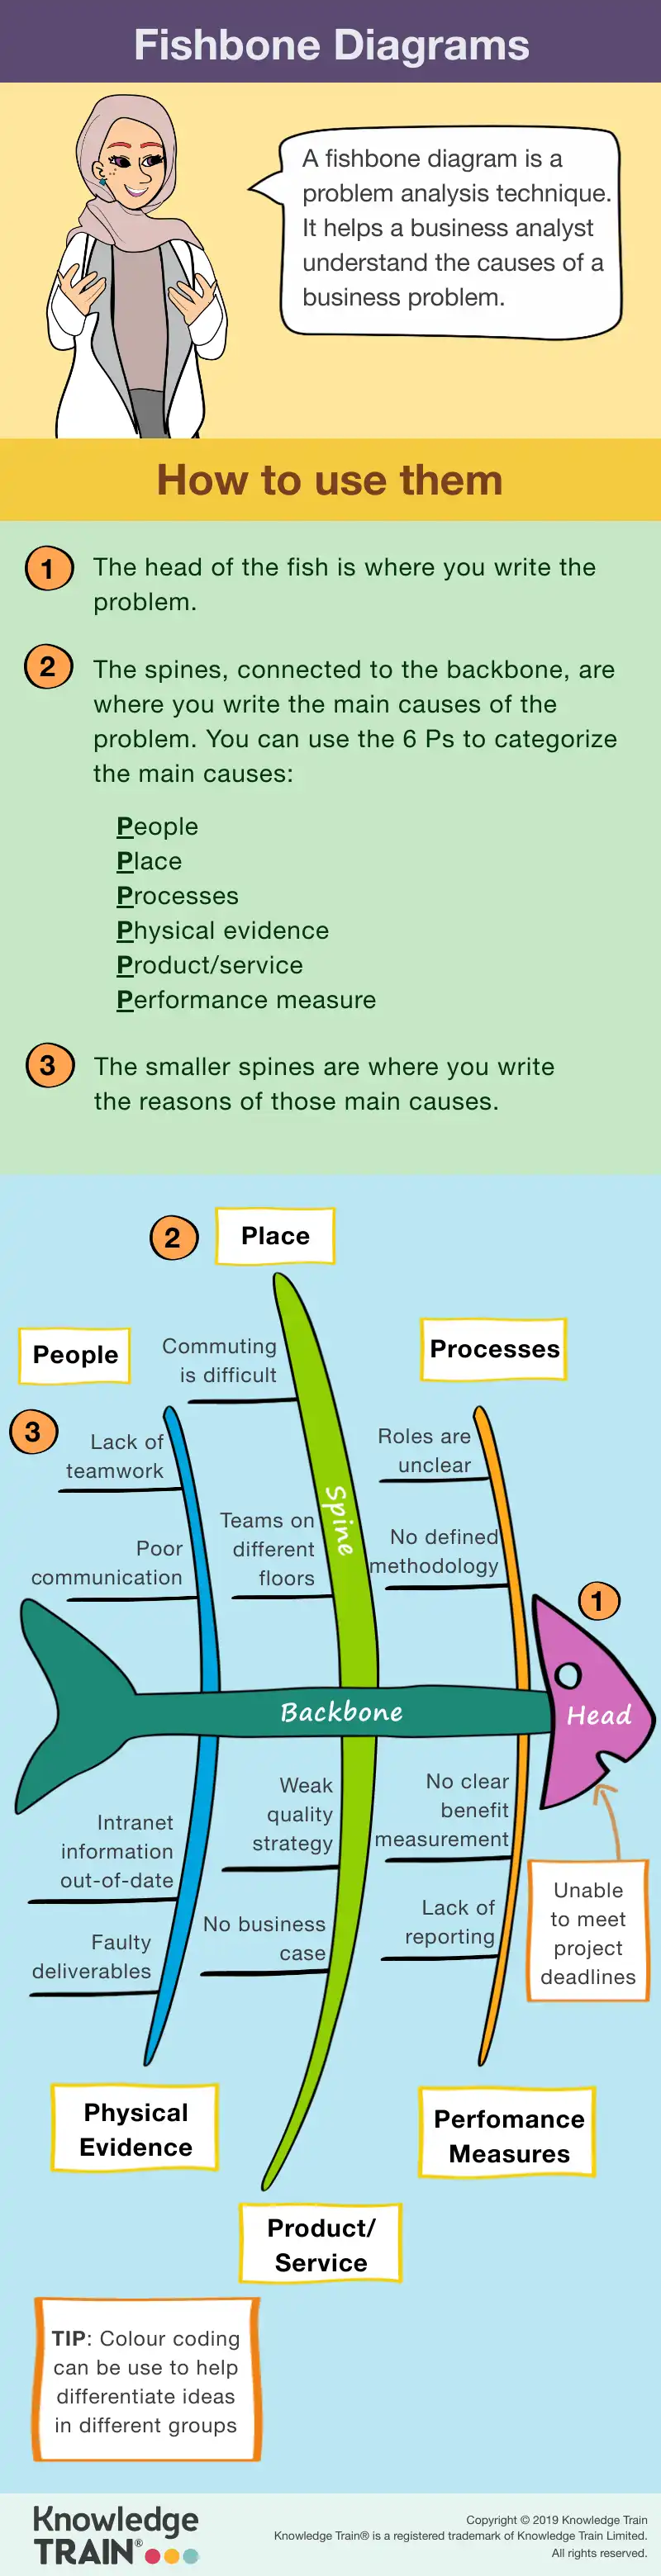
A Live Q&A with accredited trainerfishbone diagram is a visual tool that helps teams identify and categorise the root causes of a problem. The diagram resembles the skeleton of a fish, making it intuitive and straightforward to use. At the ‘head’ of the diagram, you place the problem statementFixed scheduled dates – the issue that needs addressing. This serves as the focal point of the analysis.
Branching off from the spine are the ‘bones,’ which represent potential Includedcauses of the problem. These are organised into various categories, allowing teams to explore different angles of the issue systematically. Each ‘bone’ signifies a distinct cause or factor, and further branching can detail sub-causes. This structured layout not only clarifies complex problems but also encourages comprehensive brainstorming and analysis.Digital workbook & mocks
Categories in fishbone diagrams
Standard categories1 year post-course resources
Fishbone diagrams often use standard categories to organise potential causes, especially in Learners who prefer structure & guidancequality management and engineering contexts. These categories help ensure a comprehensive analysis by covering different aspects of the problem. Commonly used categories include:Live interactive sessions with accredited trainers
- Methods : Processes or procedures that might contribute to the issueSelf-paced
- Materials : Raw materials or components involved in the process
- Machines : Equipment or tools used, which might have faults or limitationsInteractive online modules
- Manpower : Human factors, such as skills, training, or motivation20 hours
- Measurements : Data or metrics that might be inaccurate or misleadingTutor and technical support via email and phone
- Environment : External conditions or settings that could affect outcomes.Start anytime
These categories offer teams a structured approach to explore potential causes.
Custom categoriesIncluded
While standard categories are useful, organisations often benefit from tailoring categories to their specific needs or industries. Custom categories allow teams to focus on the unique aspects of their problem domain. For instance, a software development team might include categories like user experienceInteractive content & workbook or software architecture12-month access. Meanwhile, a retail business might focus on customer feedbackLearners who prefer flexibility & self-study or supply chainEngaging, interactive e-learning.
The flexibility to customise categories ensures that the fishbone diagram remains relevant and effective for any given context. By adapting the diagram to suit their specific needs, organisations can enhance the accuracy and usefulness of their analysis, leading to more targeted and effective solutions.About our e-learning design
Focus on productsAfter brainstorming, organise the identified causes into relevant categoriesTailor to suit the project. These categories can be standard ones like Methods, Materials, and Manpower, or custom ones tailored to your specific context. Proper categorisation helps in visualising the problem from different angles and ensures no potential cause is overlooked.People
Analysing and prioritising causesKey concepts related to people and project teams
The final step is to PRINCE2 practicesanalyse and prioritise the causesBusiness case. Evaluate each potential cause in terms of its impact on the problem. Use techniques such as voting or ranking to identify the most critical causes for further investigation. Focusing on these key factors will help in developing targeted and effective solutions.Organising
Practical applications and case studiesPlans
Real-world applications of fishbone diagramsQuality
Fishbone diagrams are widely used across various industries to identify and resolve complex issues. In RiskmanufacturingIssues, these diagrams help pinpoint inefficiencies in production processes, leading to improved efficiency and reduced waste. By systematically analysing potential causes, manufacturers can address issues such as equipment malfunctions or material defects.Progress
service company
: 60. Teams may overlook significant factors due to limited brainstorming or narrow focus areas. Another common issue is Pass markcategory overlap: 60% (36 correct), where causes are placed in multiple categories, leading to confusion and redundancy. These challenges can hinder the effectiveness of the diagram and compromise the analysis.Duration
Solutions and best practices: 60 minutes
To overcome these challenges, teams should employ several strategies. For Materialscomprehensive cause identification: Closed book, include team members from different departments in the brainstorming process. This ensures a broad range of perspectives and reduces the likelihood of missing critical causes. To address Prerequisitescategory overlap: None, establish clear definitions for each category before starting the analysis. This clarity helps in appropriately categorising causes and minimises redundancy. Additionally, regular reviews of the diagram during the analysis process can help identify and rectify any overlaps or omissions, enhancing the diagram’s overall effectiveness.Results
FAQs: Same day
How do fishbone diagrams differ from other problem-solving tools?Exam access