Using fishbone diagrams effectively in your projects

Key takeaways
Fishbone diagrams help teams move from symptoms to root causes with a clear, shared view of the problem.
- Define a precise problem statement first, as it determines the focus and usefulness of the analysis.
- Brainstorm widely with cross-functional characters to reduce blind spots and incomplete cause lists.
- Group causes into clear categories, using standard headings or custom ones that fit your context.
- Review the diagram during the session to catch overlaps, duplicates, and missing factors early.
- Prioritise likely high-impact causes using simple ranking or voting before investigating solutions.


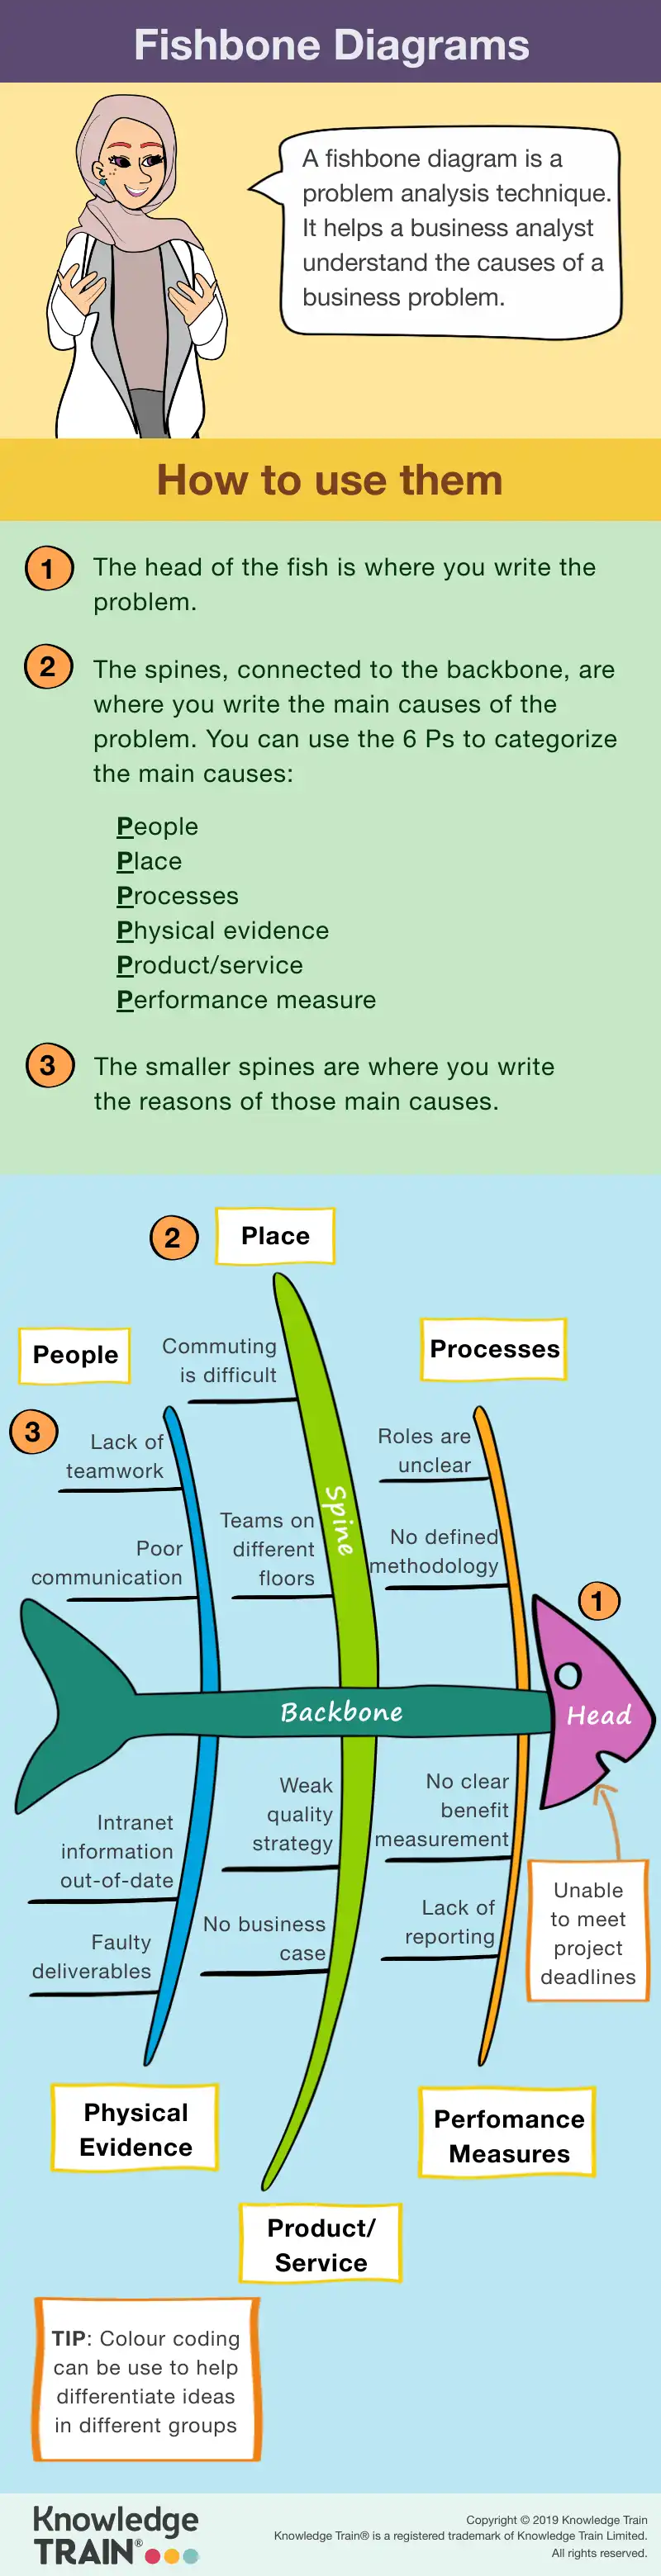
. Named after its creator, Kaoru Ishikawa, this diagram helps in identifying root causes of a problem by organising potential causes into useful categories. The visual structure resembles a fish skeleton, with the problem statement at the ‘head’ and contributing factors branching off as ‘bones.’ This structured approach facilitates effective brainstorming sessions, enabling teams to explore a wide range of possible causes systematically.
Knowledge Train Ltd is an Introducer Appointed Representative of NewDay Cards Ltd for the Newpay finance product provided by NewDay Ltd. NewDay Cards Ltd acts as a credit broker, not a lender. We will introduce you exclusively to Newpay finance products provided by NewDay Limited under this Introducer Appointed Representative arrangement. Finance available from other lenders is not covered by this arrangement. NewDay Ltd and Newday Cards Ltd are authorised and regulated by the Financial Conduct Authority (ref nos 690292 and 682417 respectively).These categories offer teams a structured approach to explore potential causes.
Fishbone diagram variations and procedures
Variations of the fishbone diagramFunctional
Fishbone diagrams come in several variations, each designed to suit specific analytical needs. These nuanced versions adapt the basic structure to address particular types of problems or sectors. For instance, some organisations may opt for a simple fishbone diagram Always active without predetermined categories. This approach allows teams to define categories that are most relevant to their context, promoting flexibility in analysis.
Other variations may incorporate additional layers of complexity. For example, a complex fishbone diagram might include sub-categories or integrate quantitative data to enhance the depth of analysis. These variations are particularly useful in industries that require detailed scrutiny, such as engineering or pharmaceuticals. By tailoring the diagram to specific needs, teams can ensure a more precise and effective root cause analysis.
Step-by-step procedure for creating a fishbone diagram
Identifying the problem
The first step in creating a fishbone diagram is to clearly define the The technical storage or access is strictly necessary for the legitimate purpose of enabling the use of a specific service explicitly requested by the subscriber or user, or for the sole purpose of carrying out the transmission of a communication over an electronic communications network.problem statement . This should be a concise description of the issue you are trying to address. A well-defined problem statement serves as the ‘head’ of the diagram and guides the entire analysis process.
Brainstorming causes
Once the problem is defined, the next step is to brainstorm potential causesPreferences. Encourage team collaboration to gather a wide range of possible factors. Use techniques such as mind mapping or group discussions to ensure all perspectives are considered. This comprehensive list of causes will form the ‘bones’ of your diagram.
Categorising causes
After brainstorming, organise the identified causes into relevant categoriesPreferences. These categories can be standard ones like Methods, Materials, and Manpower, or custom ones tailored to your specific context. Proper categorisation helps in visualising the problem from different angles and ensures no potential cause is overlooked.
Analysing and prioritising causes
Case studies showcasing successStatistics
Several organisations have successfully employed fishbone diagrams to tackle complex challenges. A notable example is a manufacturing company that faced frequent production line stoppages. By using a fishbone diagram, the team identified multiple contributing factors, including outdated machinery and insufficient staff training. Addressing these issues led to a significant reduction in downtime and increased productivity.
In healthcare , a hospital used fishbone diagrams to analyse the root causes of high patient waiting times. The analysis revealed several factors, such as inefficient scheduling and understaffed departments. Implementing targeted solutions based on these findings resulted in reduced waiting times and improved patient satisfaction.
A service companyThe technical storage or access that is used exclusively for statistical purposes.
incomplete cause identification. Teams may overlook significant factors due to limited brainstorming or narrow focus areas. Another common issue is category overlap, where causes are placed in multiple categories, leading to confusion and redundancy. These challenges can hinder the effectiveness of the diagram and compromise the analysis.
Solutions and best practices
To overcome these challenges, teams should employ several strategies. For comprehensive cause identification, include team members from different departments in the brainstorming process. This ensures a broad range of perspectives and reduces the likelihood of missing critical causes. To address category overlap, establish clear definitions for each category before starting the analysis. This clarity helps in appropriately categorising causes and minimises redundancy. Additionally, regular reviews of the diagram during the analysis process can help identify and rectify any overlaps or omissions, enhancing the diagram’s overall effectiveness.
FAQs
How do fishbone diagrams differ from other problem-solving tools?
Fishbone diagrams make it easier to see all possible causes of a problem by sorting them into clear categories. This visual organisation helps teams spot patterns and connections.
How can I use fishbone diagrams for personal problems?
Create categories relevant to your personal challenge, such as daily habits, environment, and relationships. Then list potential causes under each category to understand what’s affecting your situation.
What software tools can assist in creating fishbone diagrams?
Microsoft Visio offers professional templates, while Lucidchart and Canva provide user-friendly online options with drag-and-drop features.
How often should a fishbone diagram be revisited?
Review your diagram monthly, when new problems arise, or when you make major changes to your process or team.
Are there any limitations to using fishbone diagrams?
Fishbone diagrams work well for identifying causes but may not show how strongly each cause affects the problem. They also rely on your team’s knowledge to be effective.
Infographic