Using fishbone diagrams effectively in your projectsSubmit

Key takeaways
Fishbone diagrams help teams move from symptoms to root causes with a clear, shared view of the problem.
- Define a precise problem statement first, as it determines the focus and usefulness of the analysis.
- Brainstorm widely with cross-functional characters to reduce blind spots and incomplete cause lists.+44 (0)207 148 5985
- Group causes into clear categories, using standard headings or custom ones that fit your context.
- Review the diagram during the session to catch overlaps, duplicates, and missing factors early.[email protected]
- Prioritise likely high-impact causes using simple ranking or voting before investigating solutions.


- : Data or metrics that might be inaccurate or misleading
supply chain.
The flexibility to customise categories ensures that the fishbone diagram remains relevant and effective for any given context. By adapting the diagram to suit their specific needs, organisations can enhance the accuracy and usefulness of their analysis, leading to more targeted and effective solutions.
Fishbone diagram variations and proceduresUnderstanding fishbone diagram
Variations of the fishbone diagram
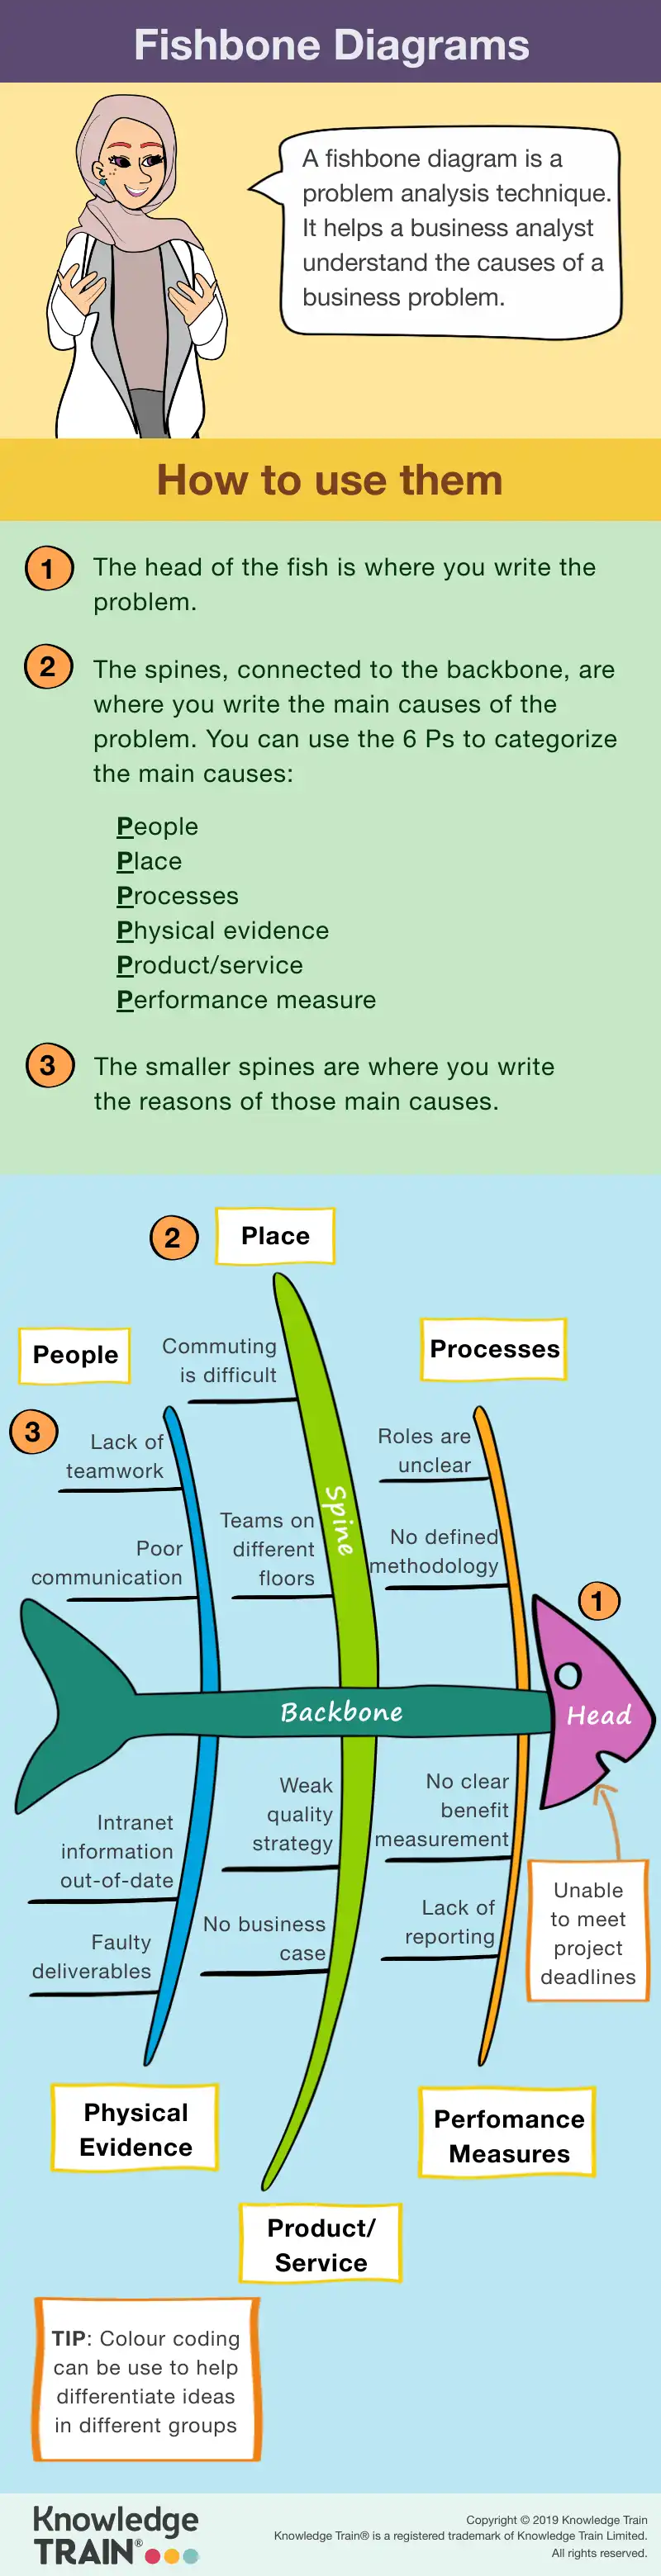
Fishbone diagrams come in several variations, each designed to suit specific analytical needs. These nuanced versions adapt the basic structure to address particular types of problems or sectors. For instance, some organisations may opt for a Variations and proceduressimple fishbone diagram without predetermined categories. This approach allows teams to define categories that are most relevant to their context, promoting flexibility in analysis.Applications and case studies
Other variations may incorporate additional layers of complexity. For example, a complex fishbone diagramChallenges and solutions might include sub-categories or integrate quantitative data to enhance the depth of analysis. These variations are particularly useful in industries that require detailed scrutiny, such as engineering or pharmaceuticals. By tailoring the diagram to specific needs, teams can ensure a more precise and effective root cause analysis.Kübler-Ross Change Curve | Knowledge Train
Step-by-step procedure for creating a fishbone diagramFAQs
Identifying the problem