Key takeaways


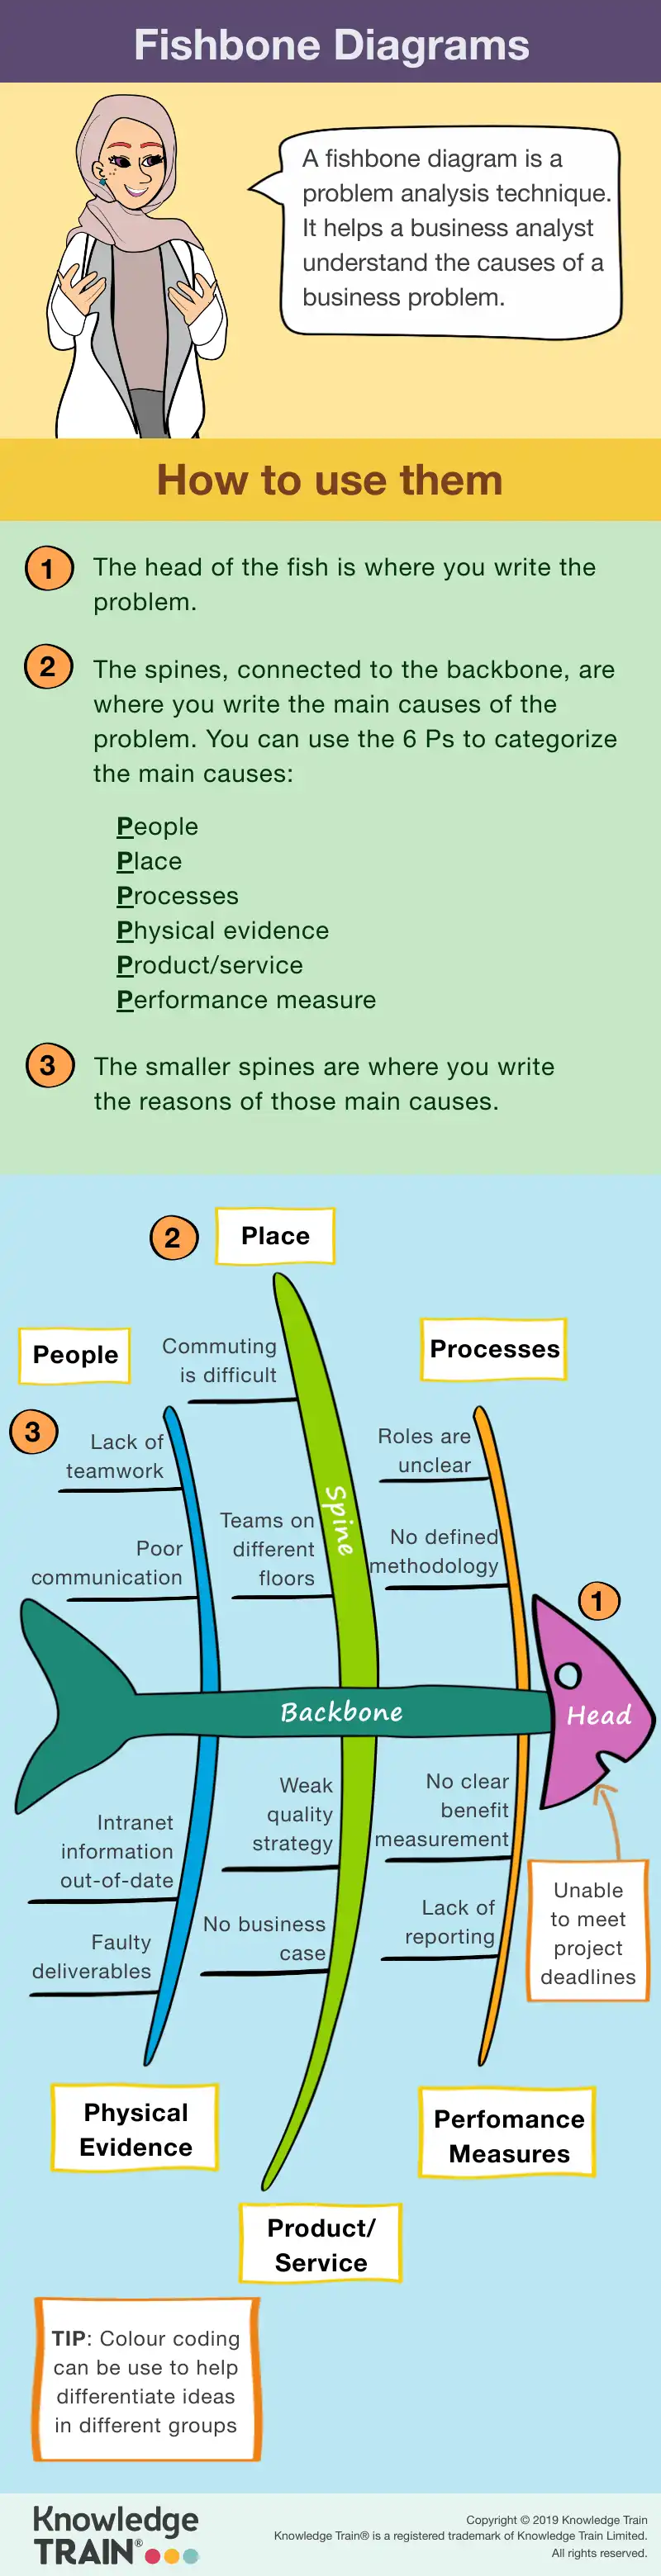
Practitioner brainstorm potential causesIncludes Foundation & Practitioner combined option.. Encourage team collaboration to gather a wide range of possible factors. Use techniques such as mind mapping or group discussions to ensure all perspectives are considered. This comprehensive list of causes will form the ‘bones’ of your diagram.Scrum
Categorising causesScrum Essentials
After brainstorming, organise the identified causes into Self-paced training course to learn the essentials of Scrum.relevant categoriesScrum Master . These categories can be standard ones like Methods, Materials, and Manpower, or custom ones tailored to your specific context. Proper categorisation helps in visualising the problem from different angles and ensures no potential cause is overlooked.Choose Scrum Alliance or Scrum.org Scrum Master training courses.
Analysing and prioritising causesScrum Product Owner
The final step is to Choose Scrum Alliance or Scrum.org Product Owner training courses.analyse and prioritise the causesAgileBA. Evaluate each potential cause in terms of its impact on the problem. Use techniques such as voting or ranking to identify the most critical causes for further investigation. Focusing on these key factors will help in developing targeted and effective solutions.®
Practical applications and case studies – Agile Business Analysis
Real-world applications of fishbone diagramsFoundation
Fishbone diagrams are widely used across various industries to identify and resolve complex issues. In Learn the fundamentals of Agile Business Analysis.manufacturingPractitioner , these diagrams help pinpoint inefficiencies in production processes, leading to improved efficiency and reduced waste. By systematically analysing potential causes, manufacturers can address issues such as equipment malfunctions or material defects.4-day course including Foundation.
In the Lean Six SigmahealthcareYellow Belt sector, fishbone diagrams are instrumental in enhancing patient safety and care quality. They allow healthcare professionals to identify factors contributing to medical errors or delays in treatment, leading to better patient outcomes.Self-paced training course to gain LSS Yellow Belt.
In the PMIservice® industry, companies employ fishbone diagrams to improve customer satisfaction. By analysing complaints and service delivery processes, businesses can identify root causes of customer dissatisfaction and implement effective solutions. This results in enhanced service quality and customer loyalty.PMI-ACP
Case studies showcasing successSelf-paced course to prepare you for the exam (exam not included).
Several organisations have successfully employed fishbone diagrams to tackle complex challenges. A notable example is a Kanbanmanufacturing companyEstimating for Agile Foundation that faced frequent production line stoppages. By using a fishbone diagram, the team identified multiple contributing factors, including outdated machinery and insufficient staff training. Addressing these issues led to a significant reduction in downtime and increased productivity.Agile Learning Library (ALL)™
In BUSINESS ANALYSIShealthcareBCS Business Analysis, a hospital used fishbone diagrams to analyse the root causes of high patient waiting times. The analysis revealed several factors, such as inefficient scheduling and understaffed departments. Implementing targeted solutions based on these findings resulted in reduced waiting times and improved patient satisfaction.Business Analysis Foundation
A Learn the fundamentals of business analysis.service companyModelling Business Processes
category overlapPMI-PBA , establish clear definitions for each category before starting the analysis. This clarity helps in appropriately categorising causes and minimises redundancy. Additionally, regular reviews of the diagram during the analysis process can help identify and rectify any overlaps or omissions, enhancing the diagram’s overall effectiveness.Self-paced course to prepare you for the exam (exam not included).
FAQsBusiness Analysis Learning Library (BALL)™
How do fishbone diagrams differ from other problem-solving tools?CHANGE MANAGEMENT
Fishbone diagrams make it easier to see all possible causes of a problem by sorting them into clear categories. This visual organisation helps teams spot patterns and connections.APMG Change Management
How can I use fishbone diagrams for personal problems?Foundation
Create categories relevant to your personal challenge, such as daily habits, environment, and relationships. Then list potential causes under each category to understand what’s affecting your situation.Learn the fundamentals of enterprise change management.
What software tools can assist in creating fishbone diagrams?Practitioner
Microsoft Visio offers professional templates, while Lucidchart and Canva provide user-friendly online options with drag-and-drop features.Includes Foundation & Practitioner combined option.
How often should a fishbone diagram be revisited?PROGRAMME MANAGEMENT
Review your diagram monthly, when new problems arise, or when you make major changes to your process or team.MSP
Are there any limitations to using fishbone diagrams?®
Fishbone diagrams work well for identifying causes but may not show how strongly each cause affects the problem. They also rely on your team’s knowledge to be effective.Foundation
InfographicLearn the fundamentals of programme management.