Using fishbone diagrams effectively in your projectsNew or aspiring project managersOUR VALUESFoundation

Key takeaways +44 (0)207 148 5985Yellow Belt
Fishbone diagrams help teams move from symptoms to root causes with a clear, shared view of the problem. Self-paced training course to gain LSS Yellow Belt.
- Define a precise problem statement first, as it determines the focus and usefulness of the analysis.Delivery[email protected]PMI
- Brainstorm widely with cross-functional characters to reduce blind spots and incomplete cause lists.Duration ®
- Group causes into clear categories, using standard headings or custom ones that fit your context.Trainer interaction PMI-ACP
- Review the diagram during the session to catch overlaps, duplicates, and missing factors early.Start date Self-paced course to prepare you for the exam (exam not included).
- Prioritise likely high-impact causes using simple ranking or voting before investigating solutions.Exam Kanban

Digital workbook & mocksCyprus

Czech Republic
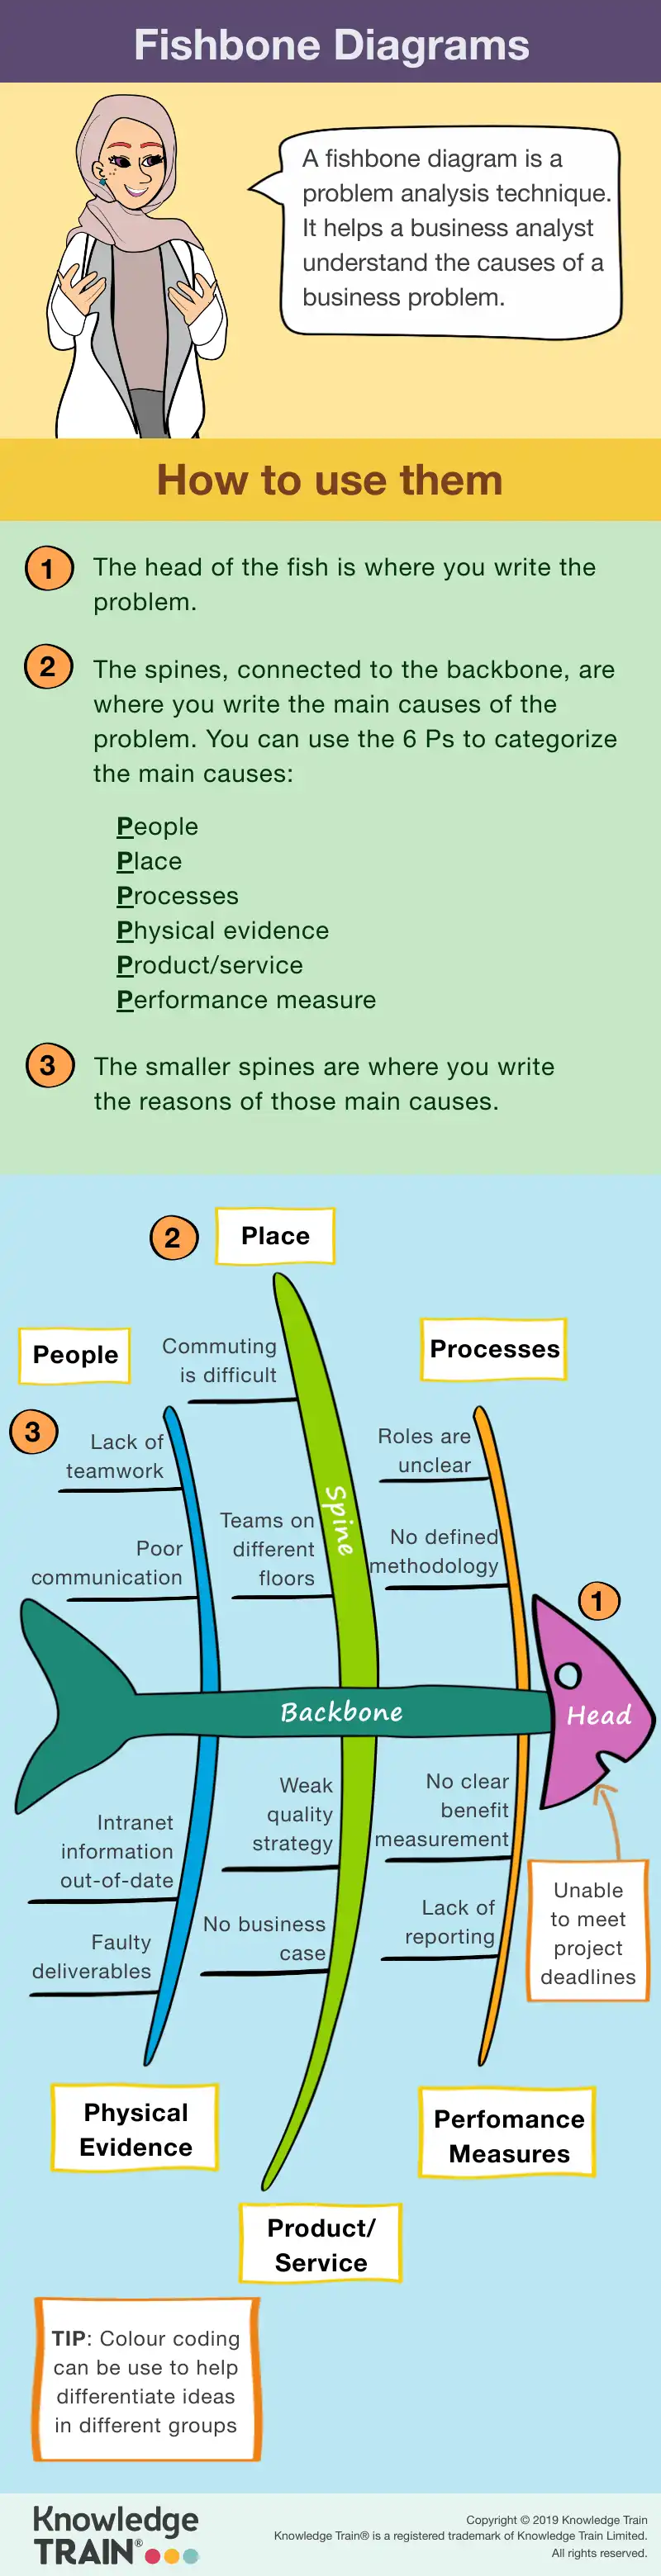
1 year post-course resourcesDenmark Estonia Learners who prefer structure & guidanceFinland Business Analysis Learning Library (BALL)™Ishikawa diagram France CHANGE MANAGEMENT or a cause-and-effect diagram, is a fundamental tool in Live interactive sessions with accredited trainersGermany APMG Change Managementquality management Greece Foundation . Named after its creator, Kaoru Ishikawa, this diagram helps in identifying root causes of a problem by organising potential causes into useful categories. The visual structure resembles a fish skeleton, with the problem statement at the ‘head’ and contributing factors branching off as ‘bones.’ This structured approach facilitates effective brainstorming sessions, enabling teams to explore a wide range of possible causes systematically.Self-pacedIreland Learn the fundamentals of enterprise change management.
Importance in problem-solving Italy Practitioner
Fishbone diagrams are vital in quality management and continuous improvement efforts across numerous industries. They are one of the Seven Basic Quality Tools, essential for identifying and resolving issues efficiently. The diagrams help teams develop specific solutions and are particularly valuable in Latvia Includes Foundation & Practitioner combined option.
- Manufacturing sectors Lithuania PROGRAMME MANAGEMENT use them to identify and address production process inefficienciesInteractive online modulesLuxemburg MSP
- Healthcare organisations Malta ® use them to improve patient care by analysing procedural issues20 hoursNetherlands Foundation
- Service industries Poland Learn the fundamentals of programme management. use them to enhance customer satisfaction by resolving service concerns.Tutor and technical support via email and phonePortugal Practitioner
In essence, fishbone diagrams not only aid in identifying the root causes of problems but also promote a culture of systematic analysis and continuous improvement. By applying this method, organisations can ensure that they address issues comprehensively, leading to more effective and lasting solutions. Romania Includes Foundation & Practitioner combined option.