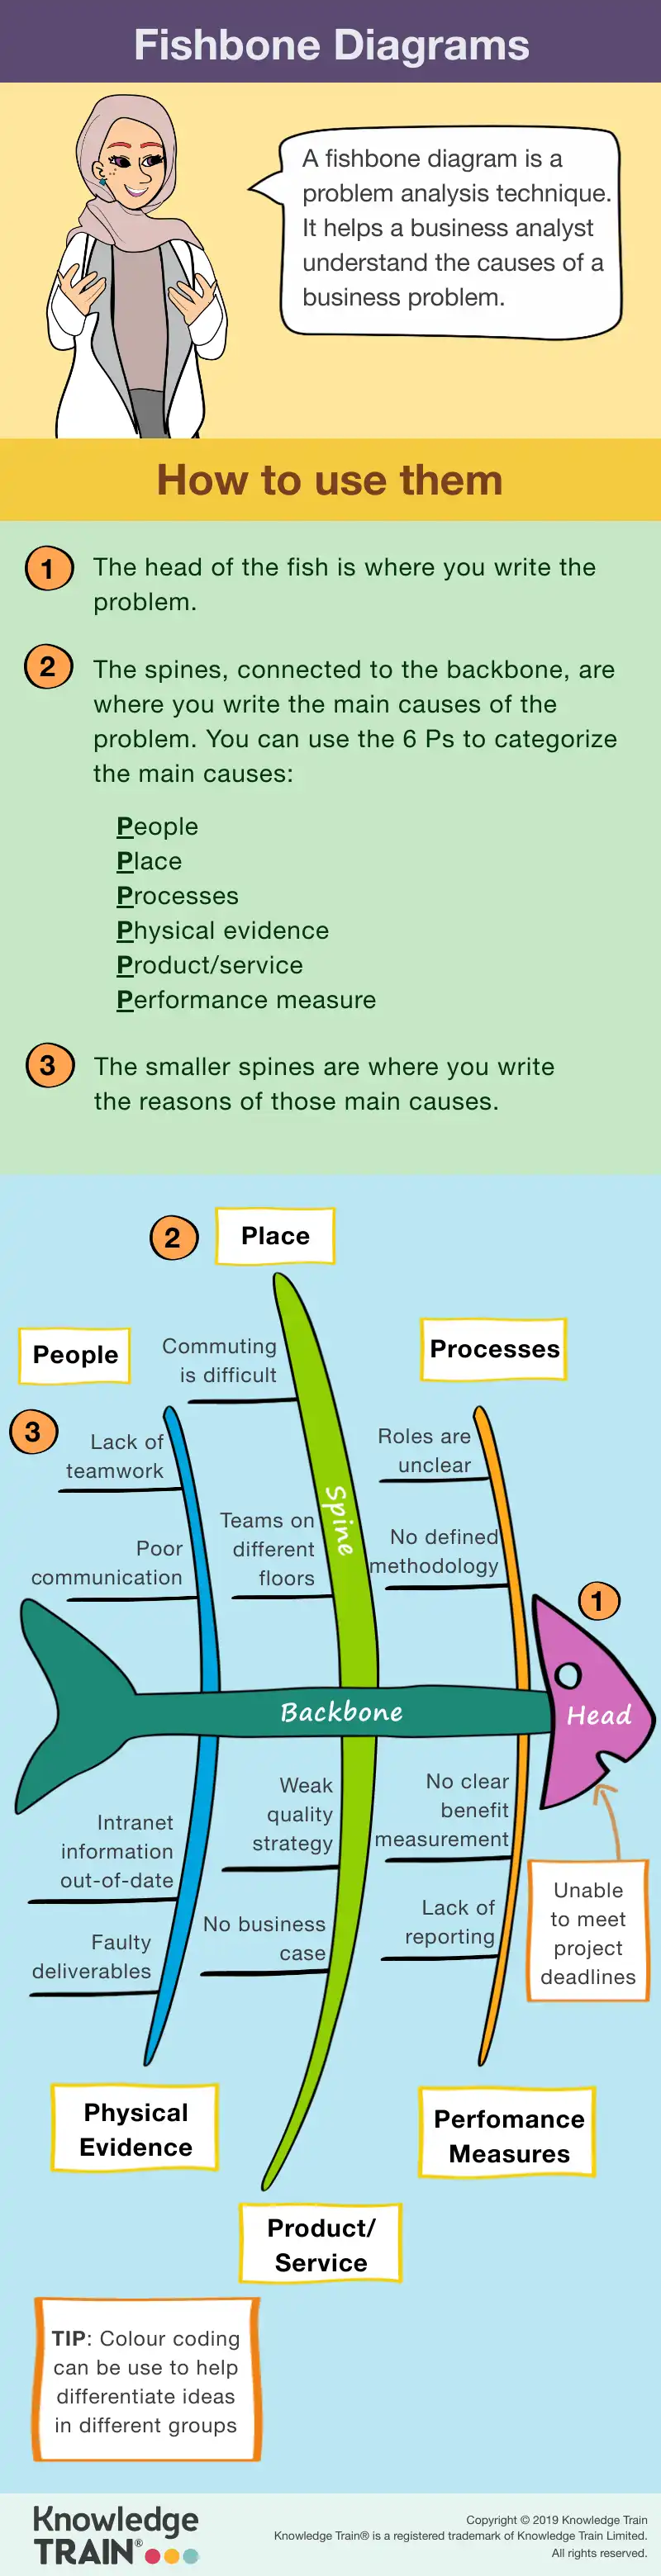

Fishbone diagrams are vital in quality management and continuous improvement efforts across numerous industries. They are one of the Seven Basic Quality Tools, essential for identifying and resolving issues efficiently. The diagrams help teams develop specific solutions and are particularly valuable in
- Manufacturing sectors use them to identify and address production process inefficiencies
- Healthcare organisations use them to improve patient care by analysing procedural issues
- Service industries use them to enhance customer satisfaction by resolving service concerns.
In essence, fishbone diagrams not only aid in identifying the root causes of problems but also promote a culture of systematic analysis and continuous improvement. By applying this method, organisations can ensure that they address issues comprehensively, leading to more effective and lasting solutions.Give us a call
Understanding fishbone diagram components
Basic structure of a fishbone diagram
A +44 (0)207 148 5985fishbone diagram is a visual tool that helps teams identify and categorise the root causes of a problem. The diagram resembles the skeleton of a fish, making it intuitive and straightforward to use. At the ‘head’ of the diagram, you place the Or chat with us using the link at the bottom of the screen.problem statementContact us with questions about the courses on this page, or about which project management certification or training is best for you. – the issue that needs addressing. This serves as the focal point of the analysis.Finance FAQs
Branching off from the spine are the ‘bones,’ which represent potential Contact
PrivacyCategories in fishbone diagrams
Standard categories
Fishbone diagramsTerms often use standard categories to organise potential causes, especially in Customer Supportquality management and engineering contexts. These categories help ensure a comprehensive analysis by covering different aspects of the problem. Commonly used categories include:[email protected]
- MethodsJoin Our Team: Processes or procedures that might contribute to the issue
- Materials[email protected]: Raw materials or components involved in the process Copyright © 2005-2026 Knowledge Train Limited.
- Machines Registered in UK: 5566983. : Equipment or tools used, which might have faults or limitations Registered VAT: GB872413526.
- Manpower Knowledge Train: Human factors, such as skills, training, or motivation®
- Measurements is a registered trademark of Knowledge Train Limited. : Data or metrics that might be inaccurate or misleading 20 Old Bailey, London, EC4M 7AN, England, United Kingdom.
- Environment Knowledge Train are experts in project management, PRINCE2, agile and change management training and certification. Choose from a full range of instructor-led and self-paced : External conditions or settings that could affect outcomes.project management courses
These categories offer teams a structured approach to explore potential causes., a
Custom categoriesPRINCE2 course
While standard categories are useful, organisations often benefit from tailoring categories to their specific needs or industries. Custom categories allow teams to focus on the unique aspects of their problem domain. For instance, a software development team might include categories like , or an user experienceagile project management course or to boost your career. software architecturePRINCE2. Meanwhile, a retail business might focus on ®
, these diagrams help pinpoint inefficiencies in production processes, leading to improved efficiency and reduced waste. By systematically analysing potential causes, manufacturers can address issues such as equipment malfunctions or material defects.Functional
In the healthcare Always active sector, fishbone diagrams are instrumental in enhancing patient safety and care quality. They allow healthcare professionals to identify factors contributing to medical errors or delays in treatment, leading to better patient outcomes.
In the service industry, companies employ fishbone diagrams to improve customer satisfaction. By analysing complaints and service delivery processes, businesses can identify root causes of customer dissatisfaction and implement effective solutions. This results in enhanced service quality and customer loyalty.
Case studies showcasing success
Several organisations have successfully employed fishbone diagrams to tackle complex challenges. A notable example is a manufacturing companyThe technical storage or access is strictly necessary for the legitimate purpose of enabling the use of a specific service explicitly requested by the subscriber or user, or for the sole purpose of carrying out the transmission of a communication over an electronic communications network.
ls. By addressing these root causes, the company successfully reduced complaints and improved overall service quality. These case studies demonstrate the effectiveness of fishbone diagrams in solving real-world problems across diverse sectors.Preferences
Common challenges and solutions
Challenges in using fishbone diagrams
While fishbone diagrams are valuable tools, they are not without challenges. One typical obstacle is incomplete cause identification . Teams may overlook significant factors due to limited brainstorming or narrow focus areas. Another common issue is category overlap , where causes are placed in multiple categories, leading to confusion and redundancy. These challenges can hinder the effectiveness of the diagram and compromise the analysis.
Solutions and best practicesThe technical storage or access is necessary for the legitimate purpose of storing preferences that are not requested by the subscriber or user.
To overcome these challenges, teams should employ several strategies. For comprehensive cause identification , include team members from different departments in the brainstorming process. This ensures a broad range of perspectives and reduces the likelihood of missing critical causes. To address category overlap , establish clear definitions for each category before starting the analysis. This clarity helps in appropriately categorising causes and minimises redundancy. Additionally, regular reviews of the diagram during the analysis process can help identify and rectify any overlaps or omissions, enhancing the diagram’s overall effectiveness.Statistics
FAQs
How do fishbone diagrams differ from other problem-solving tools?
Fishbone diagrams make it easier to see all possible causes of a problem by sorting them into clear categories. This visual organisation helps teams spot patterns and connections.
How can I use fishbone diagrams for personal problems?Statistics
Create categories relevant to your personal challenge, such as daily habits, environment, and relationships. Then list potential causes under each category to understand what’s affecting your situation.
What software tools can assist in creating fishbone diagrams?
Microsoft Visio offers professional templates, while Lucidchart and Canva provide user-friendly online options with drag-and-drop features.
How often should a fishbone diagram be revisited?
Review your diagram monthly, when new problems arise, or when you make major changes to your process or team.
Are there any limitations to using fishbone diagrams?
Fishbone diagrams work well for identifying causes but may not show how strongly each cause affects the problem. They also rely on your team’s knowledge to be effective.
InfographicThe technical storage or access that is used exclusively for statistical purposes.