Using fishbone diagrams effectively in your projectsGreece

Key takeaways
Fishbone diagrams help teams move from symptoms to root causes with a clear, shared view of the problem.The 4 Kanban principles: A visual guide
- Define a precise problem statement first, as it determines the focus and usefulness of the analysis.
- Brainstorm widely with cross-functional characters to reduce blind spots and incomplete cause lists.Simon Buehring
- Group causes into clear categories, using standard headings or custom ones that fit your context.19 Feb 2026
- Review the diagram during the session to catch overlaps, duplicates, and missing factors early.
- Prioritise likely high-impact causes using simple ranking or voting before investigating solutions.

Introduction to fishbone diagramsKanban helps teams manage work visually, reduce waste, and improve delivery through steady flow.

What is a fishbone diagram?Make work visible on a board so every character can spot progress, priorities, and problems quickly.
A Use a pull system so new work starts only when there is capacity, preventing queues and overload.fishbone diagramSet WIP limits per column to reduce multitasking and expose bottlenecks early., also known as an Focus on flow by watching for stoppages and tracking simple measures like lead time and cycle time.Ishikawa diagramContinuously review the board and adjust the process so improvements become routine, not occasional. or a cause-and-effect diagram, is a fundamental tool in quality management . Named after its creator, Kaoru Ishikawa, this diagram helps in identifying root causes of a problem by organising potential causes into useful categories. The visual structure resembles a fish skeleton, with the problem statement at the ‘head’ and contributing factors branching off as ‘bones.’ This structured approach facilitates effective brainstorming sessions, enabling teams to explore a wide range of possible causes systematically.
Importance in problem-solvingContents
Fishbone diagrams are vital in quality management and continuous improvement efforts across numerous industries. They are one of the Seven Basic Quality Tools, essential for identifying and resolving issues efficiently. The diagrams help teams develop specific solutions and are particularly valuable in
- Manufacturing sectors use them to identify and address production process inefficienciesContents
- Healthcare organisations use them to improve patient care by analysing procedural issuesIntroduction
- Service industries use them to enhance customer satisfaction by resolving service concerns.What is Kanban?
In essence, fishbone diagrams not only aid in identifying the root causes of problems but also promote a culture of systematic analysis and continuous improvement. By applying this method, organisations can ensure that they address issues comprehensively, leading to more effective and lasting solutions.
Understanding fishbone diagram componentsThe 4 principles of Kanban
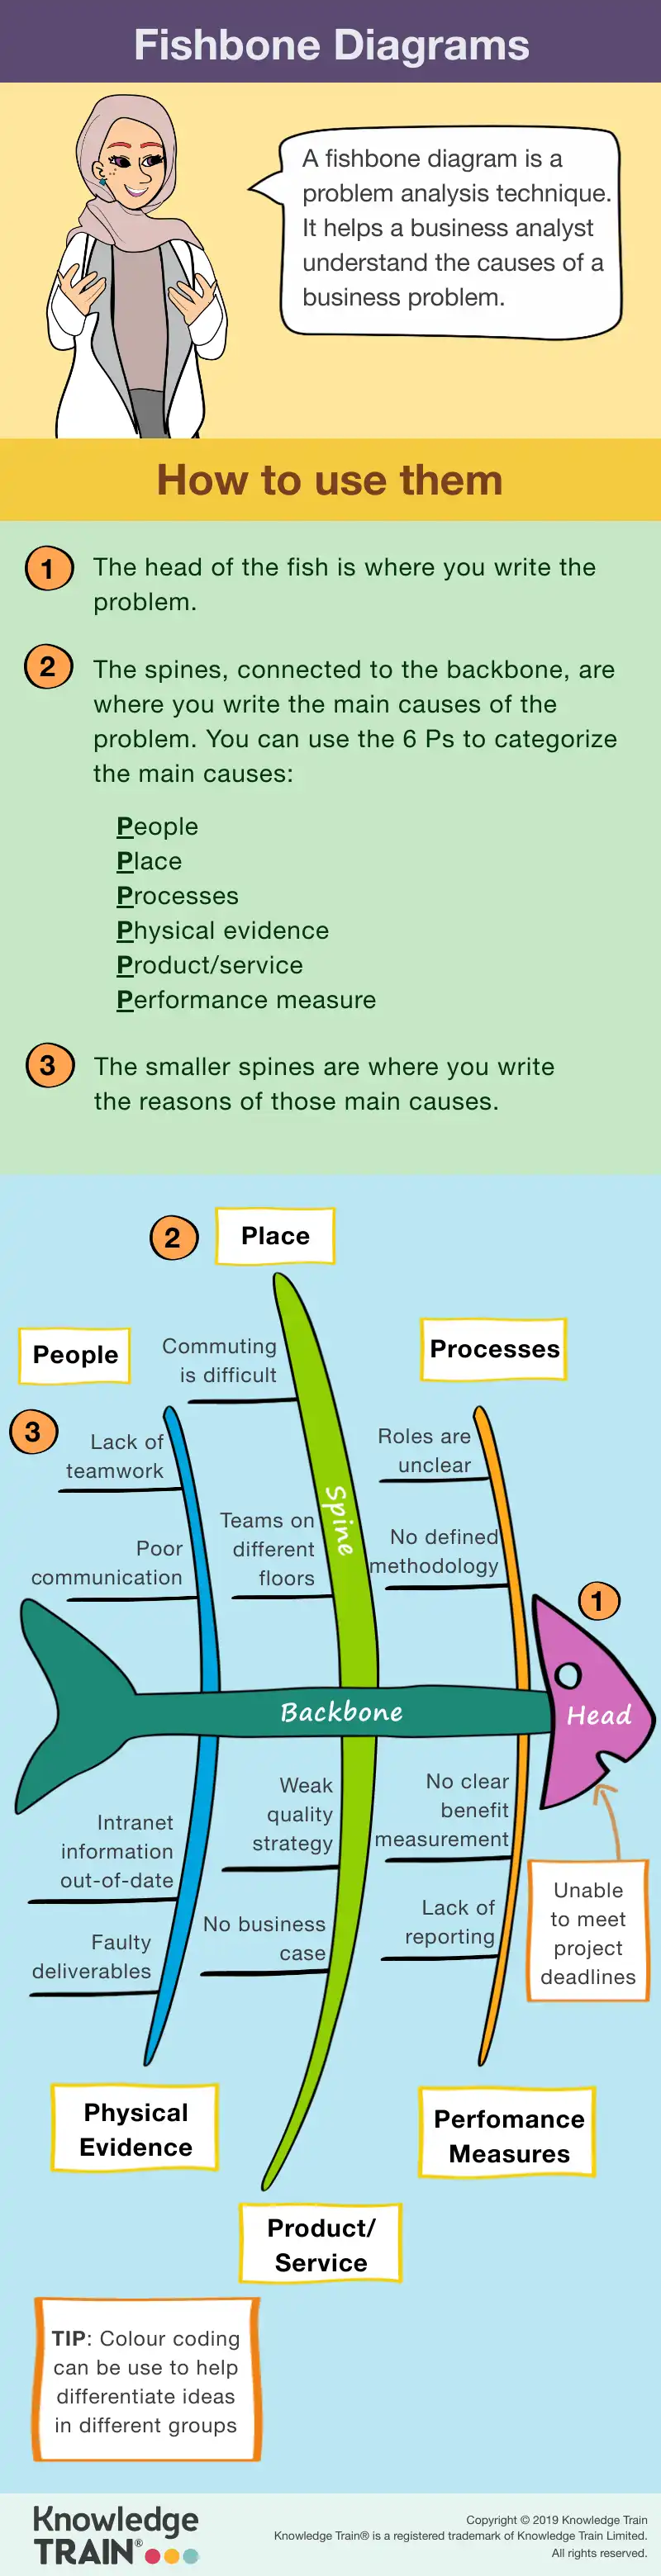
Basic structure of a fishbone diagram
A Conclusionfishbone diagramIntroduction is a visual tool that helps teams identify and categorise the root causes of a problem. The diagram resembles the skeleton of a fish, making it intuitive and straightforward to use. At the ‘head’ of the diagram, you place the Kanban is discussed on many problem statementagile courses – the issue that needs addressing. This serves as the focal point of the analysis., including a
Branching off from the spine are the ‘bones,’ which represent potential PRINCE2 Agile coursecauses and of the problem. These are organised into various categories, allowing teams to explore different angles of the issue systematically. Each ‘bone’ signifies a distinct cause or factor, and further branching can detail sub-causes. This structured layout not only clarifies complex problems but also encourages comprehensive brainstorming and analysis.Agile Project Management course
Categories in fishbone diagrams.
Standard categoriesWhat is Kanban?
Fishbone diagramsDeveloped by Toyota often use standard categories to organise potential causes, especially in Kanban is a highly visual work management method, developed in Japan in the late 1940’s by Toyota engineers. The word Kanban roughly translates in Japanese as “visual card”.quality managementLimiting waste and engineering contexts. These categories help ensure a comprehensive analysis by covering different aspects of the problem. Commonly used categories include:By displaying cards on a board, a team can easily display a workflow to everybody involved in the team. The fundamental benefit of working in this way is that any disruptions to workflow are easily identified, and team members can collaborate to rectify issues before they get out of control.
- MethodsThe approach also limits the amount of work in progress, thereby minimising any build-up of tasks which wastes time and money.: Processes or procedures that might contribute to the issuePulling work
- MaterialsKanban is based on a pull rather than a push system. This means that team members only start work when they have capacity, rather than work being pushed to them with the potential of getting piled up. Kanban can be a valuable tool when managing : Raw materials or components involved in the processprojects
- Machines that require deliverables frequently and is also a popular choice for software development teams.: Equipment or tools used, which might have faults or limitationsThe graphic below was created to help you get a basic understanding of the 4 principles of Kanban. If you like it, please show your appreciation by linking back to this page.
- ManpowerEnhance your skills with our expert-led courses: Human factors, such as skills, training, or motivation
- Measurements : Data or metrics that might be inaccurate or misleading
- EnvironmentInstructor-led: External conditions or settings that could affect outcomes.Kanban System Design (KMP1) Course
These categories offer teams a structured approach to explore potential causes.
Custom categories£995 +vat
While standard categories are useful, organisations often benefit from tailoring categories to their specific needs or industries. Custom categories allow teams to focus on the unique aspects of their problem domain. For instance, a software development team might include categories like user experienceSee all dates or software architecture . Meanwhile, a retail business might focus on customer feedbackInstructor-led or Kanban System Improvement (KMP2) coursesupply chain .£995 +vat
The flexibility to customise categories ensures that the fishbone diagram remains relevant and effective for any given context. By adapting the diagram to suit their specific needs, organisations can enhance the accuracy and usefulness of their analysis, leading to more targeted and effective solutions.
Fishbone diagram variations and procedures– how long does it take for a card to move from “Doing” to “Done”?
Variations of the fishbone diagramNumber of items not started
Fishbone diagrams come in several variations, each designed to suit specific analytical needs. These nuanced versions adapt the basic structure to address particular types of problems or sectors. For instance, some organisations may opt for a – are you struggling with your workload?simple fishbone diagramNumber of items that are WIP without predetermined categories. This approach allows teams to define categories that are most relevant to their context, promoting flexibility in analysis.– are you staying within your WIP limits?
Other variations may incorporate additional layers of complexity. For example, a Blockage areas complex fishbone diagram– do you see any areas where cards build up, causing a blockage in flow? might include sub-categories or integrate quantitative data to enhance the depth of analysis. These variations are particularly useful in industries that require detailed scrutiny, such as engineering or pharmaceuticals. By tailoring the diagram to specific needs, teams can ensure a more precise and effective root cause analysis.Top tip:
Step-by-step procedure for creating a fishbone diagramSmooth flow = creating value
Identifying the problem4. Continuous improvement
The first step in creating a fishbone diagram is to clearly define the Remember that even after implementing Kanban, the work is never truly finished. Part of the Kanban method is to continuously improve your processes. Monitor your Kanban system and make improvements on an ongoing basis.problem statementConclusion. This should be a concise description of the issue you are trying to address. A well-defined problem statement serves as the ‘head’ of the diagram and guides the entire analysis process.By following these 4 principles, you should have enough of an overview to get yourself started with a Kanban board and some cards to represent your
Brainstorming causesuser stories
Once the problem is defined, the next step is to .brainstorm potential causesFor some teams, Kanban may be all they need to effectively manage their day to day development. Kanban ensures that there is a seamless flow to your production line regardless of the type of work you do. However, you might like to use Kanban alongside a good . Encourage team collaboration to gather a wide range of possible factors. Use techniques such as mind mapping or group discussions to ensure all perspectives are considered. This comprehensive list of causes will form the ‘bones’ of your diagram.Scrum framework
Categorising causes, which will provide even more structure and organisational improvements.
After brainstorming, organise the identified causes into Subscribe to our exclusive offers and promotionsrelevant categories . These categories can be standard ones like Methods, Materials, and Manpower, or custom ones tailored to your specific context. Proper categorisation helps in visualising the problem from different angles and ensures no potential cause is overlooked.Subscribe now
Analysing and prioritising causes
The final step is to analyse and prioritise the causes. Evaluate each potential cause in terms of its impact on the problem. Use techniques such as voting or ranking to identify the most critical causes for further investigation. Focusing on these key factors will help in developing targeted and effective solutions.
Practical applications and case studies
Real-world applications of fishbone diagrams
Fishbone diagrams are widely used across various industries to identify and resolve complex issues. In manufacturing{"@context":"https://schema.org","@type":"ImageObject","contentUrl":"https://www.knowledgetrain.co.uk/training-courses/kanban-principles-890x501.webp","description":"Using Kanban To Manage Your Workflow","license":"https://www.knowledgetrain.co.uk/license","acquireLicensePage":"https://www.knowledgetrain.co.uk/license","creditText":"Knowledge Train","uploadDate":"2023-05-18T06:34:48.000Z","copyrightNotice":"© 2023 Knowledge Train Limited. All rights reserved.","creator":{"@type":"Organization","name":"Knowledge Train","url":"https://www.knowledgetrain.co.uk"}}, these diagrams help pinpoint inefficiencies in production processes, leading to improved efficiency and reduced waste. By systematically analysing potential causes, manufacturers can address issues such as equipment malfunctions or material defects.
In the {"@context":"https://schema.org","@type":"ImageObject","contentUrl":"https://www.knowledgetrain.co.uk/training-courses/res/images/agile/kanban/kanban-principles-infographic.webp","description":"kanban principles","license":"https://www.knowledgetrain.co.uk/license","acquireLicensePage":"https://www.knowledgetrain.co.uk/license","creditText":"Knowledge Train","uploadDate":"2023-05-18T06:34:48.000Z","copyrightNotice":"© 2023 Knowledge Train Limited. All rights reserved.","creator":{"@type":"Organization","name":"Knowledge Train","url":"https://www.knowledgetrain.co.uk"}}healthcare sector, fishbone diagrams are instrumental in enhancing patient safety and care quality. They allow healthcare professionals to identify factors contributing to medical errors or delays in treatment, leading to better patient outcomes.Related articles
In the
ls. By addressing these root causes, the company successfully reduced complaints and improved overall service quality. These case studies demonstrate the effectiveness of fishbone diagrams in solving real-world problems across diverse sectors.19 Feb 2026
Common challenges and solutions
Challenges in using fishbone diagramsLearn about the two most popular Agile project management courses in the UK. Discover which course suits your professional needs by reading further.
While fishbone diagrams are valuable tools, they are not without challenges. One typical obstacle is incomplete cause identification . Teams may overlook significant factors due to limited brainstorming or narrow focus areas. Another common issue is category overlap , where causes are placed in multiple categories, leading to confusion and redundancy. These challenges can hinder the effectiveness of the diagram and compromise the analysis.
Solutions and best practices
To overcome these challenges, teams should employ several strategies. For comprehensive cause identificationWhat is the best Agile project management certification?, include team members from different departments in the brainstorming process. This ensures a broad range of perspectives and reduces the likelihood of missing critical causes. To address category overlapSimon Buehring, establish clear definitions for each category before starting the analysis. This clarity helps in appropriately categorising causes and minimises redundancy. Additionally, regular reviews of the diagram during the analysis process can help identify and rectify any overlaps or omissions, enhancing the diagram’s overall effectiveness.19 Feb 2026
FAQs
How do fishbone diagrams differ from other problem-solving tools?Explore what makes a great Agile project management certification and how it can propel your career. Scroll down for the top choices.
Fishbone diagrams make it easier to see all possible causes of a problem by sorting them into clear categories. This visual organisation helps teams spot patterns and connections.
How can I use fishbone diagrams for personal problems?
Create categories relevant to your personal challenge, such as daily habits, environment, and relationships. Then list potential causes under each category to understand what’s affecting your situation.
What software tools can assist in creating fishbone diagrams?
Microsoft Visio offers professional templates, while Lucidchart and Canva provide user-friendly online options with drag-and-drop features.
How often should a fishbone diagram be revisited?
Review your diagram monthly, when new problems arise, or when you make major changes to your process or team.
Are there any limitations to using fishbone diagrams?MoSCoW prioritisation method
Fishbone diagrams work well for identifying causes but may not show how strongly each cause affects the problem. They also rely on your team’s knowledge to be effective.
InfographicSimon Buehring