Using fishbone diagrams effectively in your projects

- Review the diagram during the session to catch overlaps, duplicates, and missing factors early.
- Prioritise likely high-impact causes using simple ranking or voting before investigating solutions.

Introduction to fishbone diagrams

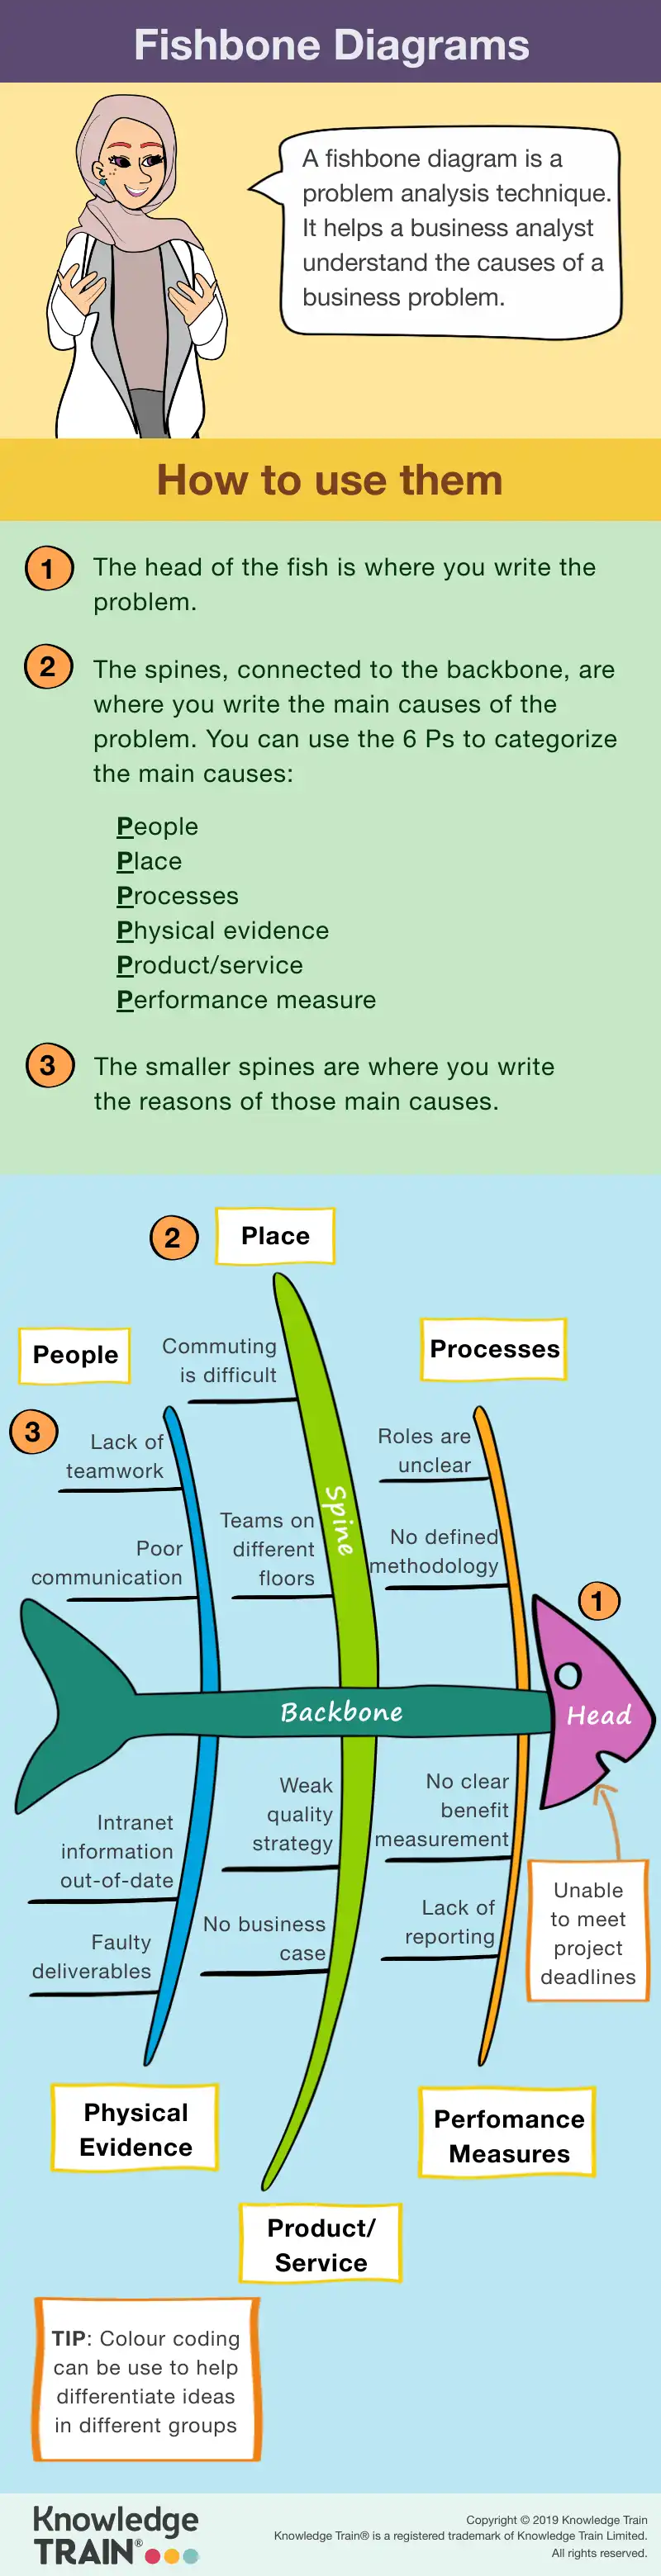
A fishbone diagram , also known as an Ishikawa diagram or a cause-and-effect diagram, is a fundamental tool in quality management . Named after its creator, Kaoru Ishikawa, this diagram helps in identifying root causes of a problem by organising potential causes into useful categories. The visual structure resembles a fish skeleton, with the problem statement at the ‘head’ and contributing factors branching off as ‘bones.’ This structured approach facilitates effective brainstorming sessions, enabling teams to explore a wide range of possible causes systematically.
Importance in problem-solving
Fishbone diagrams are vital in quality management and continuous improvement efforts across numerous industries. They are one of the Seven Basic Quality Tools, essential for identifying and resolving issues efficiently. The diagrams help teams develop specific solutions and are particularly valuable in
- Manufacturing sectors use them to identify and address production process inefficiencies
- Healthcare organisations use them to improve patient care by analysing procedural issues
- Service industries use them to enhance customer satisfaction by resolving service concerns.
In essence, fishbone diagrams not only aid in identifying the root causes of problems but also promote a culture of systematic analysis and continuous improvement. By applying this method, organisations can ensure that they address issues comprehensively, leading to more effective and lasting solutions.
Custom categories
While standard categories are useful, organisations often benefit from tailoring categories to their specific needs or industries. Custom categories allow teams to focus on the unique aspects of their problem domain. For instance, a software development team might include categories like user experience or software architecture . Meanwhile, a retail business might focus on customer feedback or supply chain .
The flexibility to customise categories ensures that the fishbone diagram remains relevant and effective for any given context. By adapting the diagram to suit their specific needs, organisations can enhance the accuracy and usefulness of their analysis, leading to more targeted and effective solutions.
Fishbone diagram variations and procedures
Variations of the fishbone diagram
Fishbone diagrams come in several variations, each designed to suit specific analytical needs. These nuanced versions adapt the basic structure to address particular types of problems or sectors. For instance, some organisations may opt for a simple fishbone diagram without predetermined categories. This approach allows teams to define categories that are most relevant to their context, promoting flexibility in analysis.
Other variations may incorporate additional layers of complexity. For example, a complex fishbone diagram might include sub-categories or integrate quantitative data to enhance the depth of analysis. These variations are particularly useful in industries that require detailed scrutiny, such as engineering or pharmaceuticals. By tailoring the diagram to specific needs, teams can ensure a more precise and effective root cause analysis.
Step-by-step procedure for creating a fishbone diagram
Identifying the problem
The first step in creating a fishbone diagram is to clearly define the problem statement. This should be a concise description of the issue you are trying to address. A well-defined problem statement serves as the ‘head’ of the diagram and guides the entire analysis process.
Brainstorming causes
Once the problem is defined, the next step is to brainstorm potential causes . Encourage team collaboration to gather a wide range of possible factors. Use techniques such as mind mapping or group discussions to ensure all perspectives are considered. This comprehensive list of causes will form the ‘bones’ of your diagram.
Categorising causes
After brainstorming, organise the identified causes into relevant categories . These categories can be standard ones like Methods, Materials, and Manpower, or custom ones tailored to your specific context. Proper categorisation helps in visualising the problem from different angles and ensures no potential cause is overlooked.
Analysing and prioritising causes
The final step is to analyse and prioritise the causes . Evaluate each potential cause in terms of its impact on the problem. Use techniques such as voting or ranking to identify the most critical causes for further investigation. Focusing on these key factors will help in developing targeted and effective solutions.
Practical applications and case studies
Fishbone diagrams are widely used across various industries to identify and resolve complex issues. In manufacturing , these diagrams help pinpoint inefficiencies in production processes, leading to improved efficiency and reduced waste. By systematically analysing potential causes, manufacturers can address issues such as equipment malfunctions or material defects.
In the healthcare sector, fishbone diagrams are instrumental in enhancing patient safety and care quality. They allow healthcare professionals to identify factors contributing to medical errors or delays in treatment, leading to better patient outcomes.
In the service industry, companies employ fishbone diagrams to improve customer satisfaction. By analysing complaints and service delivery processes, businesses can identify root causes of customer dissatisfaction and implement effective solutions. This results in enhanced service quality and customer loyalty.
Case studies showcasing success
Several organisations have successfully employed fishbone diagrams to tackle complex challenges. A notable example is a manufacturing company that faced frequent production line stoppages. By using a fishbone diagram, the team identified multiple contributing factors, including outdated machinery and insufficient staff training. Addressing these issues led to a significant reduction in downtime and increased productivity.
In healthcare , a hospital used fishbone diagrams to analyse the root causes of high patient waiting times. The analysis revealed several factors, such as inefficient scheduling and understaffed departments. Implementing targeted solutions based on these findings resulted in reduced waiting times and improved patient satisfaction.
A service company