Key takeawaysprojects
PESTLE helps organisations anticipate external change and make steadier strategic choices. with uncertain or variable task durations. Developed in the 1950s for the U.S. Navy’s Polaris missile program, PERT allows project managers to incorporate probabilistic time estimates into their project schedules.
- PERT requires the creation of a network diagram of all project tasks, along with three time estimates for each task:
- Optimistic time (O): The shortest time the task could possibly take.Foundation
- Using PESTLE to inform SWOT links external conditions to internal strengths and weaknesses for better decisions.Most likely time (M): The best estimate of how long the task will take, based on available information.Learn the fundamentals of ITIL service management.
- A useful template captures the key drivers under each factor and assesses likely impact on the organisation.Strategist DPI Pessimistic time (P): The longest time the task could possibly take, considering all potential issues.
- Regular reviews, often quarterly, keep the analysis current as policies, markets and technology shift.3-day ITIL Strategist: Direct, Plan & Improve (DPI) course.The expected time (E) for each task is then calculated as E = (O + 4M + P) / 6.
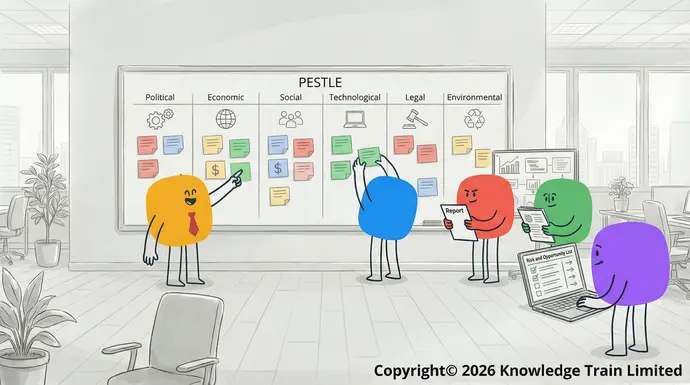
Introduction to PESTLE analysisA Kanban board is a visual tool that helps teams manage their work using Kanban methodology. The board is divided into columns that represent the stages of a workflow, for example, “To Do”, “In Progress”, and “Done”. Cards or sticky notes are placed on the board to represent the work items or tasks, and they are moved from one column to another as the work progresses. This way, the team can:Select your preferred training course below:
Definition and purposeVisualise workflow: The status of all tasks is visible at a glance.
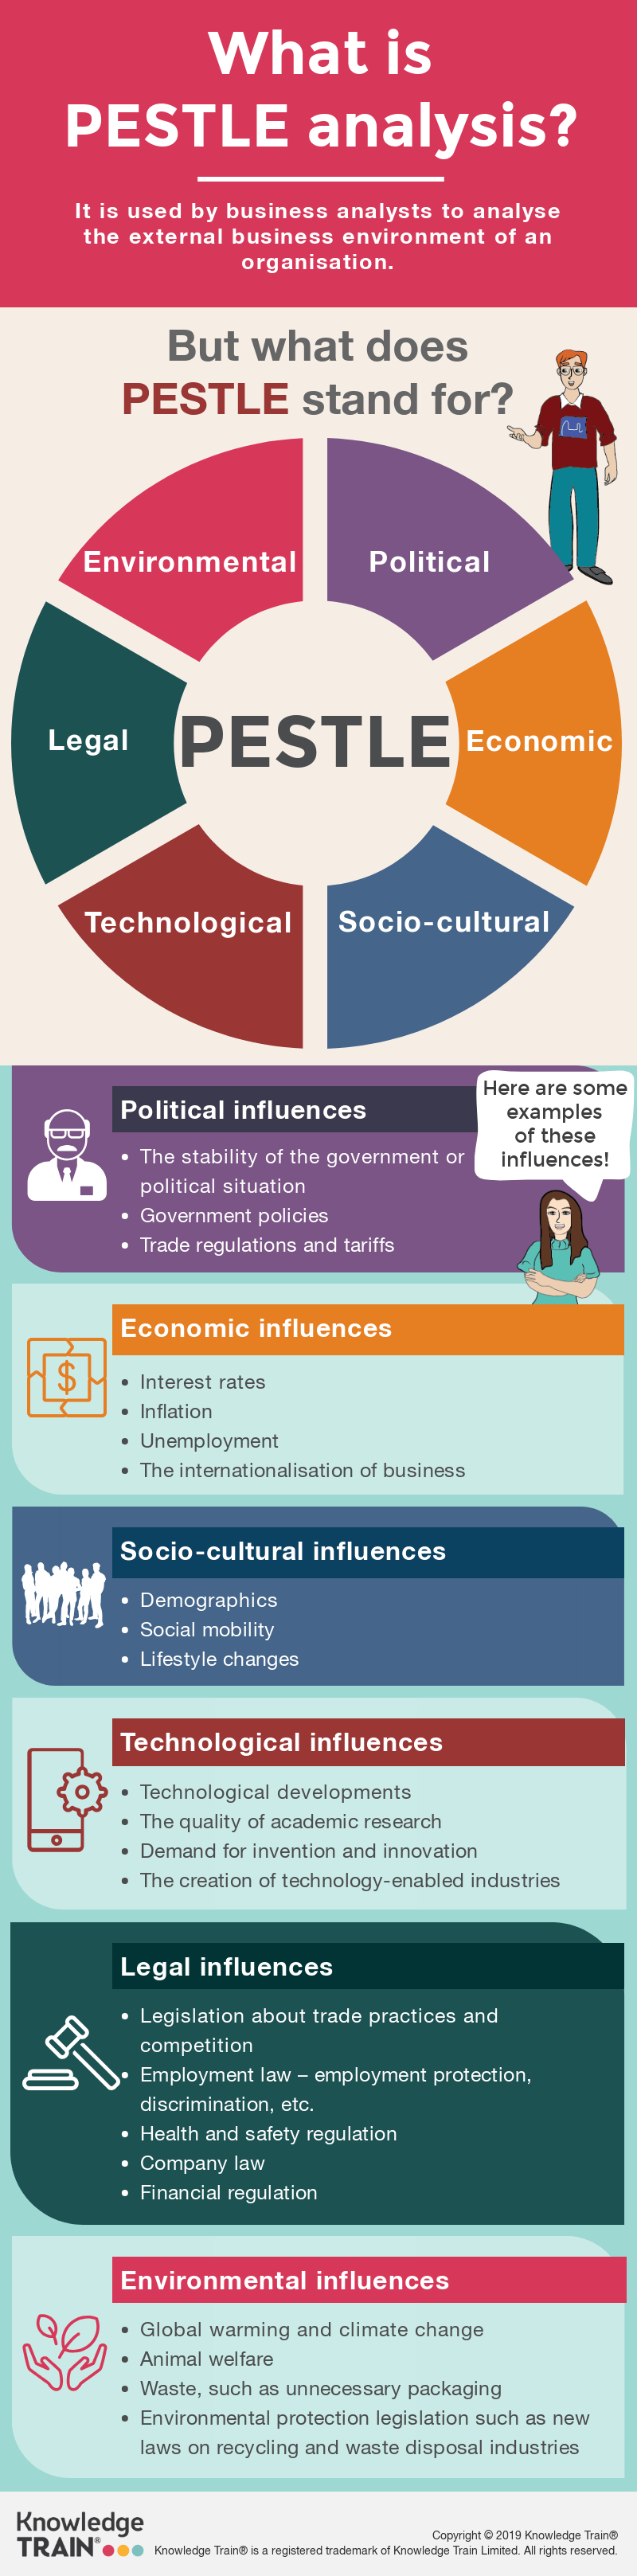
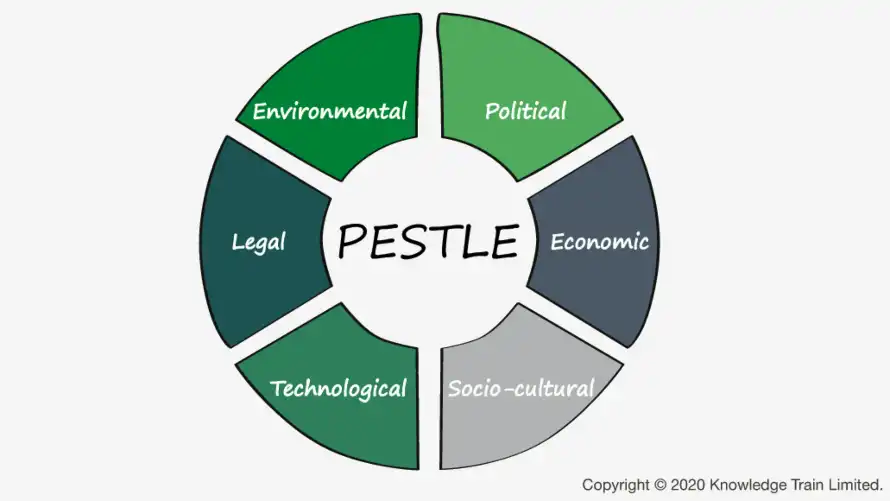
PESTLE analysisLimit work in progress: Limits are set on the number of tasks in each column to avoid overloading the team.APM COURSES is a strategic tool used to identify and assess the external factors that can impact a business. It stands for Political, Economic, Social, Technological, Legal, and Environmental factors. The primary purpose of PESTLE analysis is to provide a comprehensive understanding of the macro-environmental conditions affecting an organisation. By evaluating these external forces, businesses can anticipate changes and adapt their strategies accordingly. This proactive approach aids in mitigating risks and capitalising on potential opportunities.Manage flow: Blockers are quickly identified and resolved.Select your preferred training course below:
Evolution from PEST to PESTLEContinuous improvement: The team optimises the workflow over time.
The framework began as ETPS, created by Francis Aguilar in 1967, before being rearranged to PEST, focusing on Political, Economic, Social and Technological aspects. Over time, the need to address Legal and Environmental factors led to the evolution of PEST into PESTLE analysis. This expansion reflects the growing complexity of the business environment, where legal compliance and Benefits of using Kanban boards include:AGILE PROJECT MANAGEMENT COURSESsustainabilityImproved transparency and communicationSelect your preferred training course below: have become crucial considerations. The incorporation of these additional factors allows organisations to build a more robust strategic plan. PESTLE analysis complements Increased focus and productivity SWOT analysisFlexibility to adapt to changing prioritiesPRINCE2 AGILE COURSES, offering insights into external factors whilst SWOT examines both external and internal elements. This combined approach enhances decision-making by aligning organisational strengths with external opportunities while addressing potential threats.Reduced waste of time and resources.Select your preferred training course below:
Components of PESTLE analysisKanban boards can be physical or digital. A physical board can be as simple as a whiteboard and some sticky notes. A digital board is a virtual representation of the physical board that can be accessed and updated by the team members using
Political factorsproject management softwareBETTER BUSINESS CASES COURSES
Government policies and stability. Digital boards offer more features, such as automatic updates, task details, and integration with other tools.Select your preferred training course below:
Government policies are a significant influence on business environments. Changes in taxation, labour laws, or trade restrictions can alter market dynamics. Political stability is equally important, as it fosters a predictable environment for investment. Businesses must monitor policy changes to maintain compliance and align strategies with governmental priorities.Implementing Kanban boards is easy, but it requires the team to be committed to updating the board regularly and following the work-in-progress limits.
Trade regulations and tariffsRisk and stakeholder managementP3O COURSES
Trade regulations and tariffs affect businesses entering or expanding in new markets. Import duties may limit market access whilst trade agreements can create opportunities. Understanding these regulations helps businesses navigate international markets effectively, mitigating risks associated with cross-border trade.Risk management matrixSelect your preferred training course below:
Economic factorsA
Economic growth and exchange ratesRisk Management MatrixWORKSHOPS
Economic growth is a key indicator of market potential. During periods of growth, consumer spending typically increases, leading to higher demand for goods and services. Exchange rates also play a pivotal role, affecting the cost of imports and exports. Businesses must adapt pricing and sourcing strategies to manage currency fluctuations., also referred to as a Probability and Impact Matrix, is a graphical representation used in project management to prioritise and manage risks. It allows project managers and teams to evaluate potential risks based on their likelihood of occurrence and potential impact on the project.Select your preferred workshop below:
Inflation and interest ratesThe matrix typically displays a grid with probability on one axis and impact on the other. Risks are plotted on this grid, enabling quick visual identification of high-priority risks that require immediate attention and action.
Inflation and interest rates profoundly impact consumer behaviour. High inflation erodes purchasing power, while interest rates influence borrowing costs. Businesses must adjust their pricing strategies to remain competitive and manage debt effectively during fluctuating economic conditions.Essential elements in a Risk Management Matrix:AGILE QUALIFICATIONS
Social factorsProbability: The chance of a risk happening (typically rated as low, medium, high)Select your preferred qualification.
Cultural norms and demographicsImpact: The severity of the outcome if the risk occurs (usually ranked from minor to major)
Cultural norms and demographics shape consumer preferences and behaviours. Understanding these social factors helps businesses tailor products and marketing strategies to meet the needs of diverse populations. Demographic shifts, such as an ageing population, can also create new market opportunities.Risk score: A value obtained by multiplying the probability and impact assessments.AGILE PROJECT MANAGEMENT COURSES
Lifestyle changesAdvantages of employing a Risk Management Matrix:Select your preferred training course below:
Lifestyle changes, driven by shifts in social values and technological advancements, affect consumer demands. As lifestyles evolve, businesses must innovate to offer products and services that align with emerging trends, such as increased health consciousness or digital engagement.Facilitates a clear, visual summary of potential project risks.
Technological factorsAssists in prioritising risk responses.PRINCE2 AGILE COURSES
Technological advancementsImproves risk communication with stakeholders.Select your preferred training course below:
Technological advancements drive business transformation by enhancing operational efficiency and enabling new business models. Companies must stay abreast of technological trends to capitalise on innovation, whether through automation, artificial intelligence, or other emerging technologies.Aids in making more informed decisions.
Research and developmentTips for effective use:SCRUM COURSES
Update the matrix regularly as new risks emerge or situations evolve.
Engage the whole project team in risk identification and evaluation.
Formulate specific mitigation or contingency plans for prioritised risks.
Periodically review and revise risk ratings and assumptions.
By systematically identifying, evaluating, and addressing risks,
Stakeholder mapping
is a visual technique to analyse and prioritise stakeholders for your project based on their interest, influence, and impact on the project.
Key takeaways
Self-paced
PRINCE2 Agile Practitioner (with Foundation) self-paced online
- £1,399 +vat
- Self-paced
- AgilePM Practitioner (with Foundation) self-paced online
- £1,299 +vatFinancial and resource management
- Earned Value Management (EVM)Earned Value Management
(EVM) is a project management technique that uses scope, schedule, and cost data to assess a project’s progress and performance. It integrates scope, schedule, and cost measures to provide a comprehensive view of the project’s health. EVM compares the planned work with the actual completed work and the actual costs incurred, offering insights into both the status and future projections of the project.
The key components of EVM are:
Planned Value (PV): The budgeted cost of work scheduled to be done
- Earned Value (EV): The budgeted cost of work performedActual Cost (AC): The actual cost incurred for work performed.
- EVM is used to compute the following metrics:Schedule Variance (SV) = EV – PV